Flood Risk & Housing Markets
My role: Creator & principal researcher
Context: Doctoral dissertation · University of Illinois Chicago
Methods & tools: R · sf · targets · ArcGIS Pro · Quarto
The question
How do housing markets respond to new information about flood risk? My dissertation, Risk Perception and Real Estate Values in Cook County, Illinois (2026), examines FEMA floodplain-map updates and the public availability of First Street Foundation Flood Factor scores.
What I built
I developed a longitudinal research database connecting 2006–2025 residential sales with parcel and building geometries, multiple vintages of FEMA flood maps, FIRM panel information, and property-level flood-risk measures. The work required matching information across both space and time: a property’s classification can change with a new map, and a parcel and its building do not necessarily have the same floodplain exposure.
I built reproducible spatial workflows in R using sf and targets, with parallel validation approaches in ArcGIS Pro. The pipeline tracks dependencies between source files and derived outputs, while Quarto documents bring together diagnostics, maps, and methodological notes.
Before the models: a spatial-data pipeline
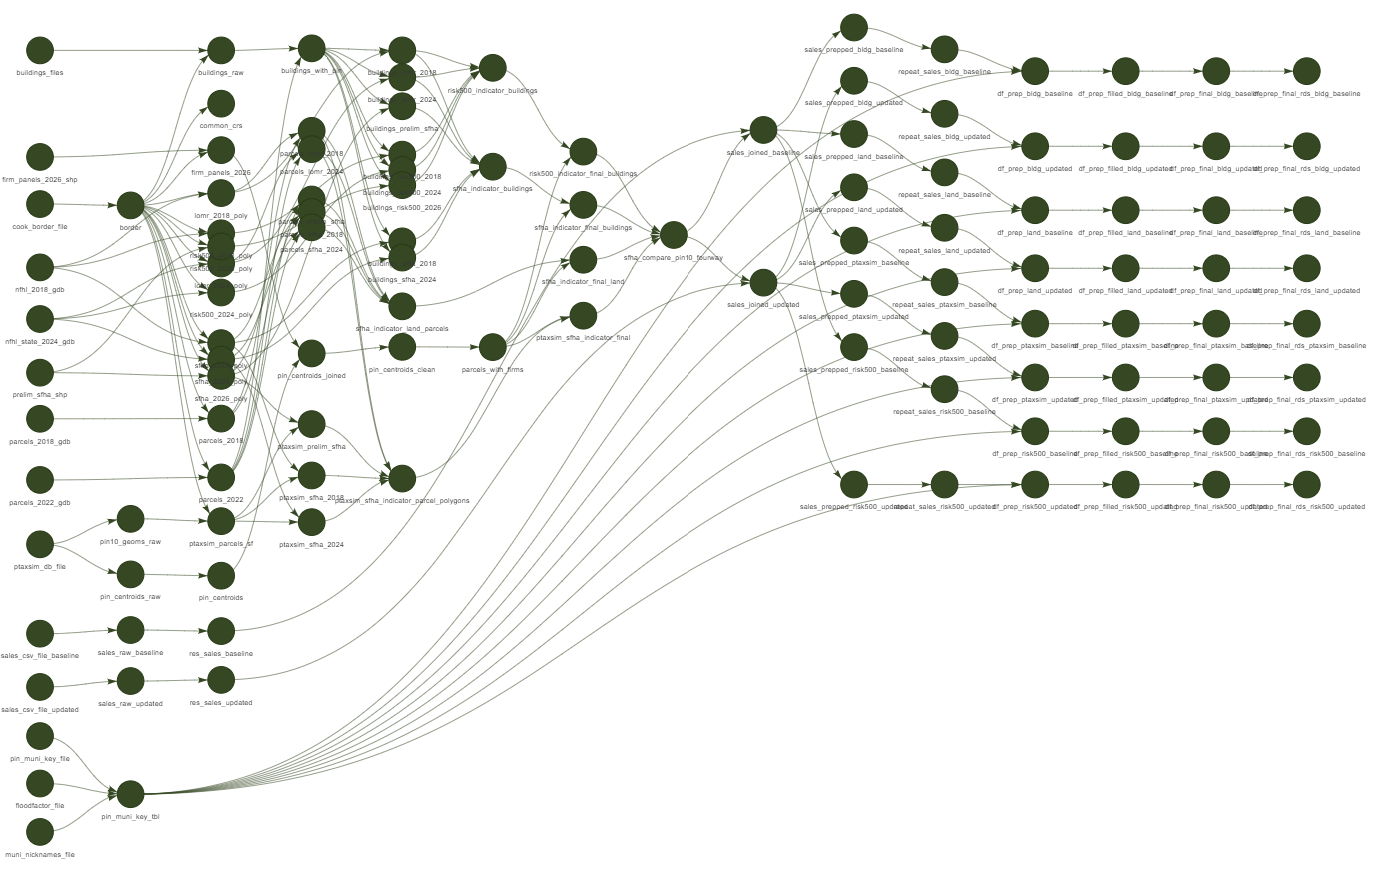
The targets graph makes the work before modeling visible. Source files feed coordinate-system alignment, parcel and building intersections, geographic classifications, and joins to sales records. Those steps produce alternative analysis datasets rather than a single unexplained final file. Tracking the dependencies also helps identify which outputs need updating when an input changes.
Seeing differences in flood risk
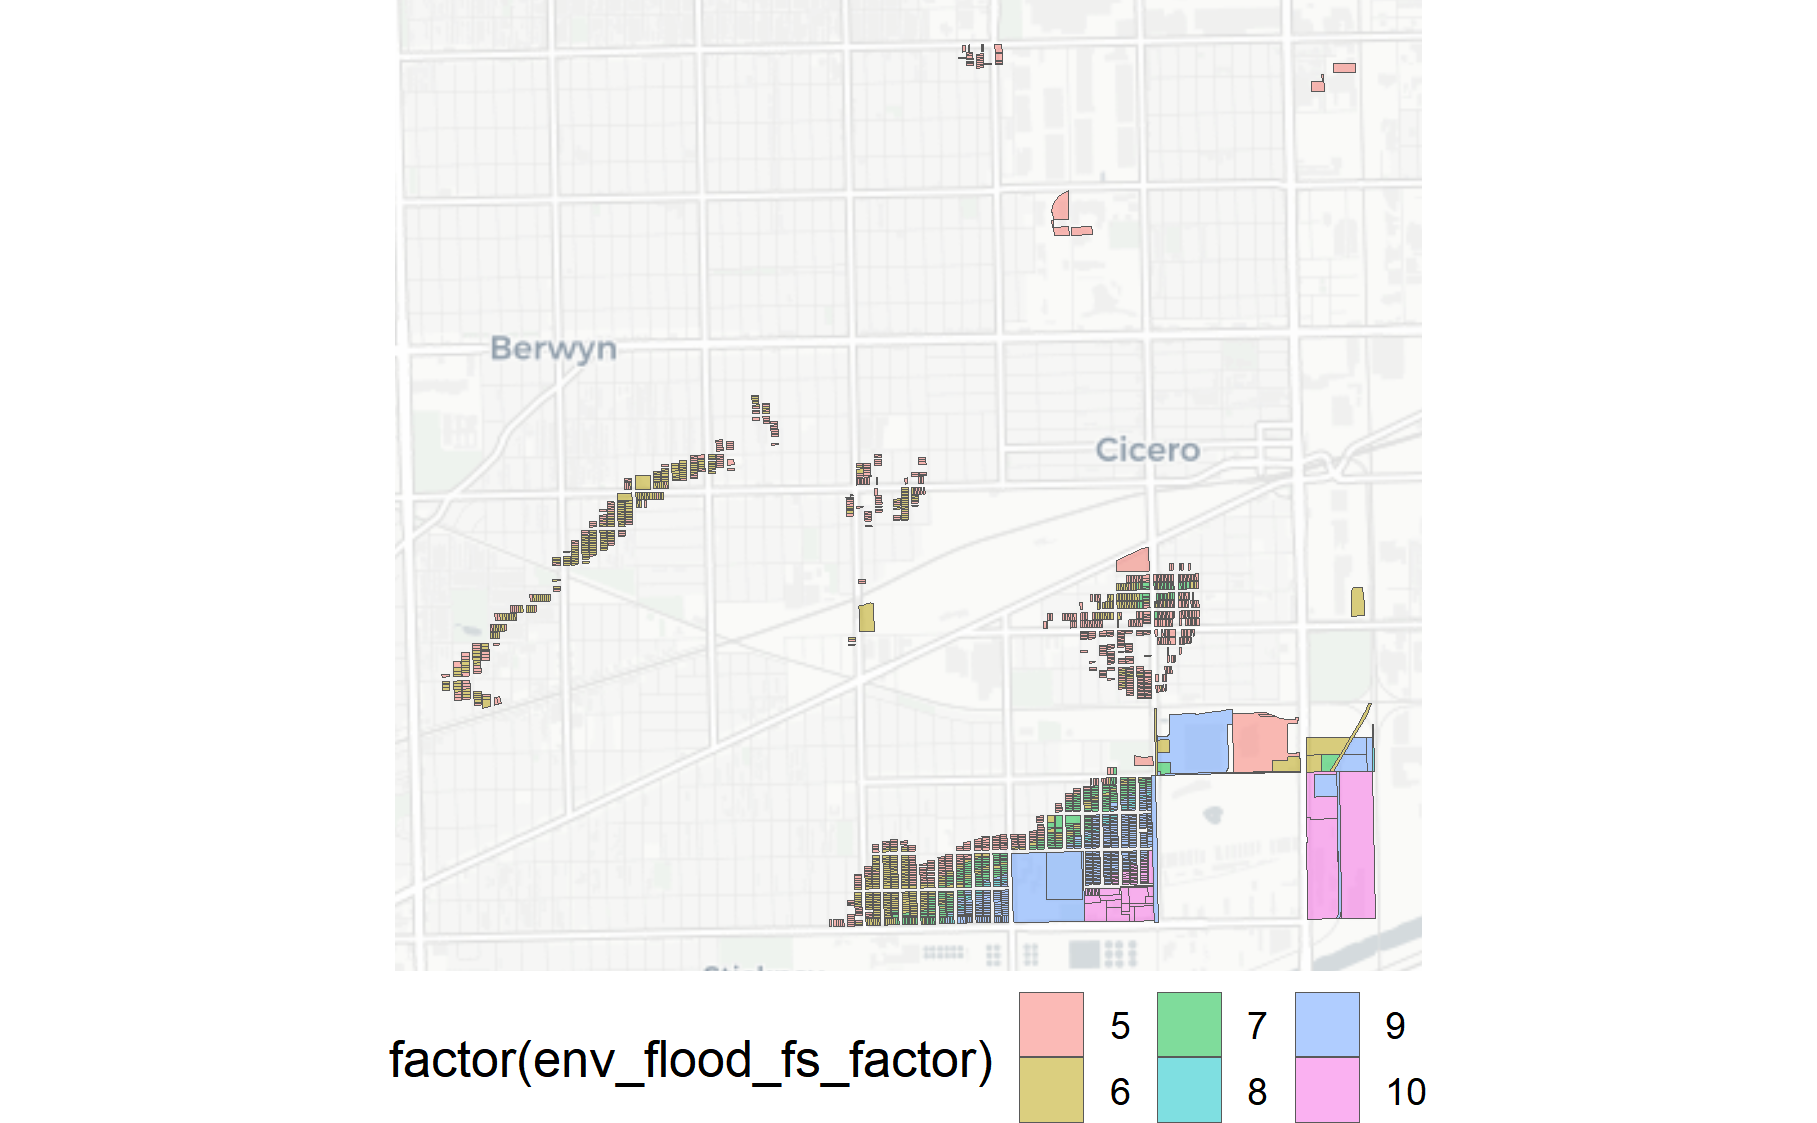
This map colors selected properties by their Flood Factor score, rather than by property class. It shows scores of 5–10 in the displayed area and makes the variation within the selected properties visible. It is a different view of risk from the FEMA floodplain classifications used elsewhere in the dissertation.
Analytical approach
The research uses property and year fixed effects, difference-in-differences, event studies, and heterogeneous-effects analyses. Supporting materials document assumption checks, alternative exposure definitions, and robustness analyses so readers can inspect the choices behind the estimates.
A decision that matters
Defining exposure is part of the research design. Whether a flood zone intersects a parcel or the building on that parcel can change which properties enter an analysis. Making those definitions explicit connects the spatial processing to the question the model actually answers.
Research outputs
The public supplemental site brings together tables, figures, code notes, data-construction decisions, and analyses that could not fit in the final dissertation. It provides a route from the written research to the underlying evidence.