Fiscal Futures
My role: Repository creator & lead developer; report coauthor
Context: Institute of Government and Public Affairs · University of Illinois System
Methods & tools: R · Fiscal data harmonization · Quarto · GitHub
The question
How do Illinois’ revenues and expenditures change over time, and what do those trends imply for the state’s fiscal condition? Fiscal Futures combines recurring policy research with the less visible work of making annual fiscal records comparable.
My contribution
I coauthored Fiscal Futures research and created the public data, code, and methodology infrastructure supporting the annual analysis. I rebuilt inherited workflows in R, reviewed historical coding decisions, corrected identified inconsistencies, and documented procedures for future updates.
The data work includes tracking changes in agencies, funds, revenue sources, and classification systems. Reused fund numbers and reorganizations require more than stacking annual files: the meaning of a record must be considered alongside its identifier.
A public methodology resource
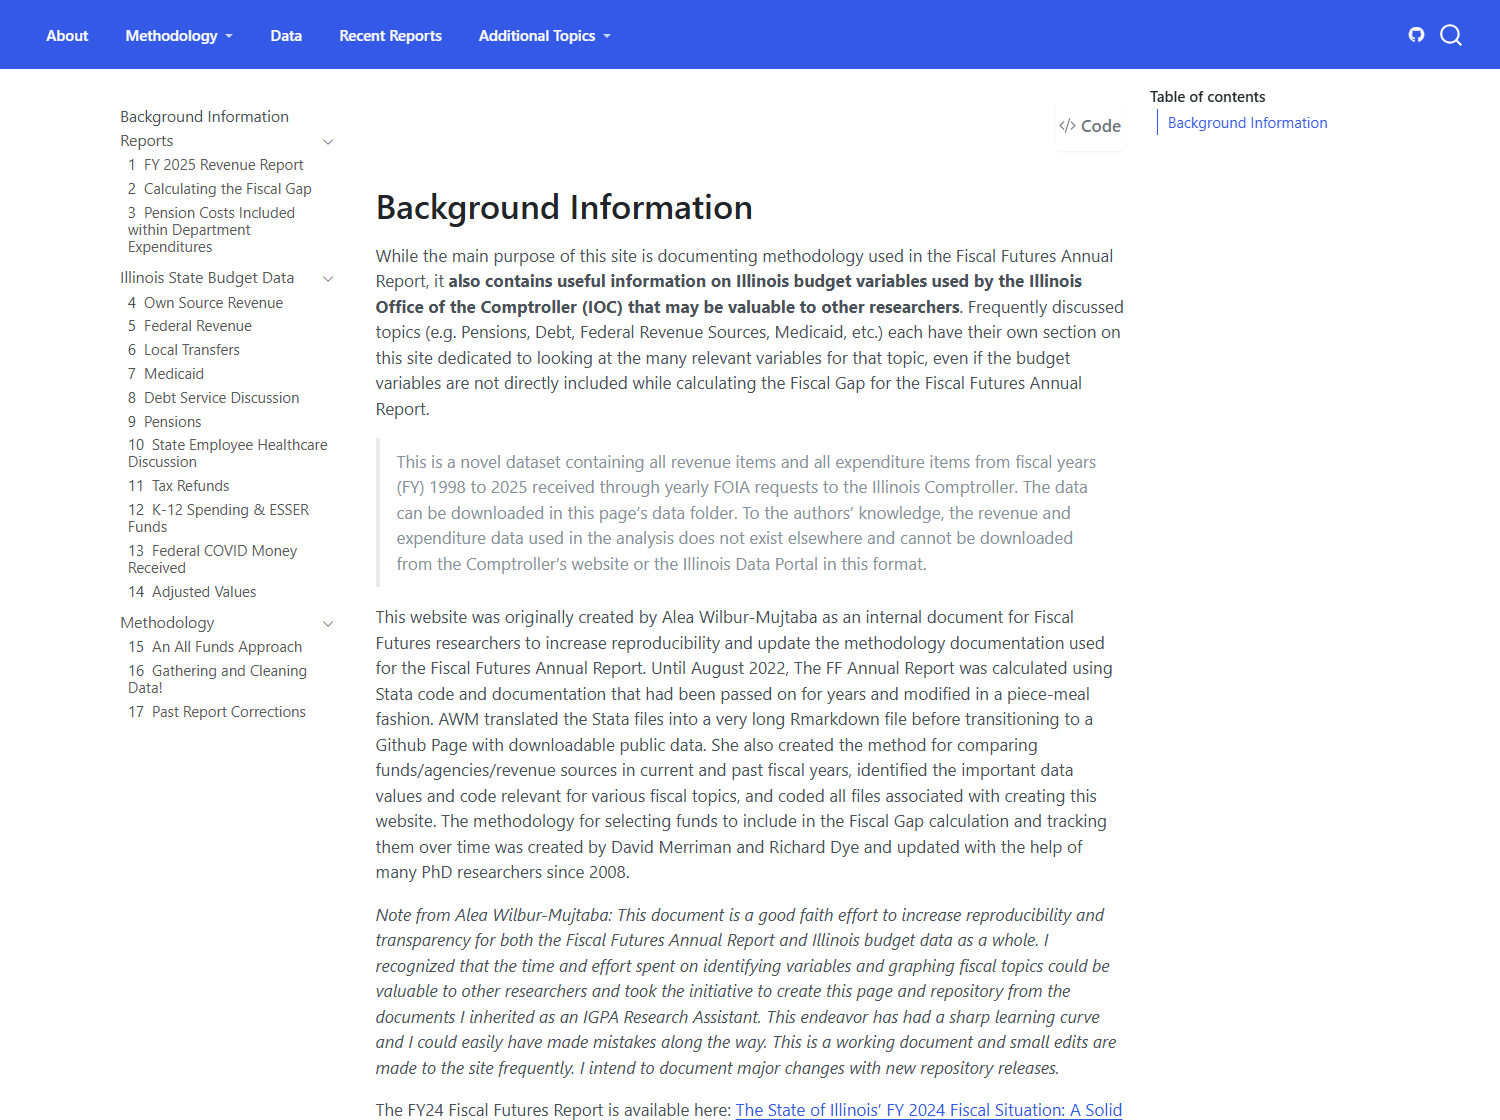
The methodology site documents the subjects behind the annual totals: own-source and federal revenue, local transfers, Medicaid, debt, pensions, healthcare, refunds, education, COVID funding, and the decisions involved in gathering and cleaning the data. The screenshot shows the breadth of that documentation; the live site provides the detailed chapters and code.
Making annual research maintainable
I developed a public Quarto website with downloadable data, code, methodology, and guidance for future annual updates. The goal is to let a future researcher understand how totals were constructed and where a change in source data requires a decision.
A decision that matters
A fiscal measure depends on its inclusion rules. Transfers and other accounting flows need to be handled deliberately to interpret revenues and expenditures. Documenting those rules makes the difference between reproducing a chart and understanding what it measures.
Selected report visualizations
Some research questions call for a figure built specifically for one report. These visualizations are another part of my contribution, alongside the recurring data and methodology work.
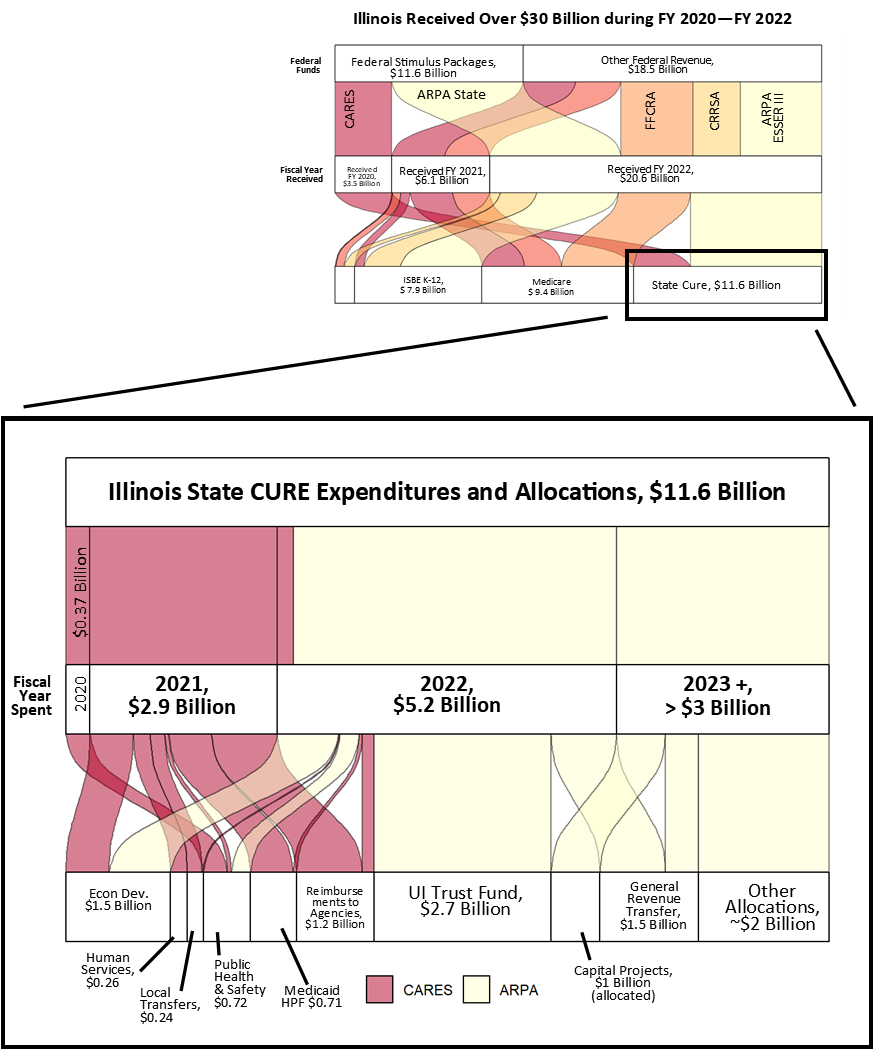
These Sankey diagrams trace how COVID-era federal funding moved from its sources through receipt years and spending or allocation categories, including flows involving different agencies and programs. Following those connections helps explain where the money went in a way that a single annual total cannot. The figures describe the historical report analysis, rather than the current state budget.