Table 2.1: Summary of Homestead Exemption Use in Cook County (Tax Year 2022
Metric
Total*
PINs
1,865,016
PINs (w/ exemps.)
1,011,876
Taxed EAV
184.08 B
Exempt EAV
15.57 B
GHE
10.01 B
Senior
2.69 B
Senior Freeze
2.45 B
Other Exemps.
0.47 B
*EAV in billions.
EqAV is the 2022 equalization factor multiplied by assessed value. Thus, Taxed EAV and Exempt EAV equal EqAV. It can be thought of as the “maximum available tax base” in a world without exemptions.
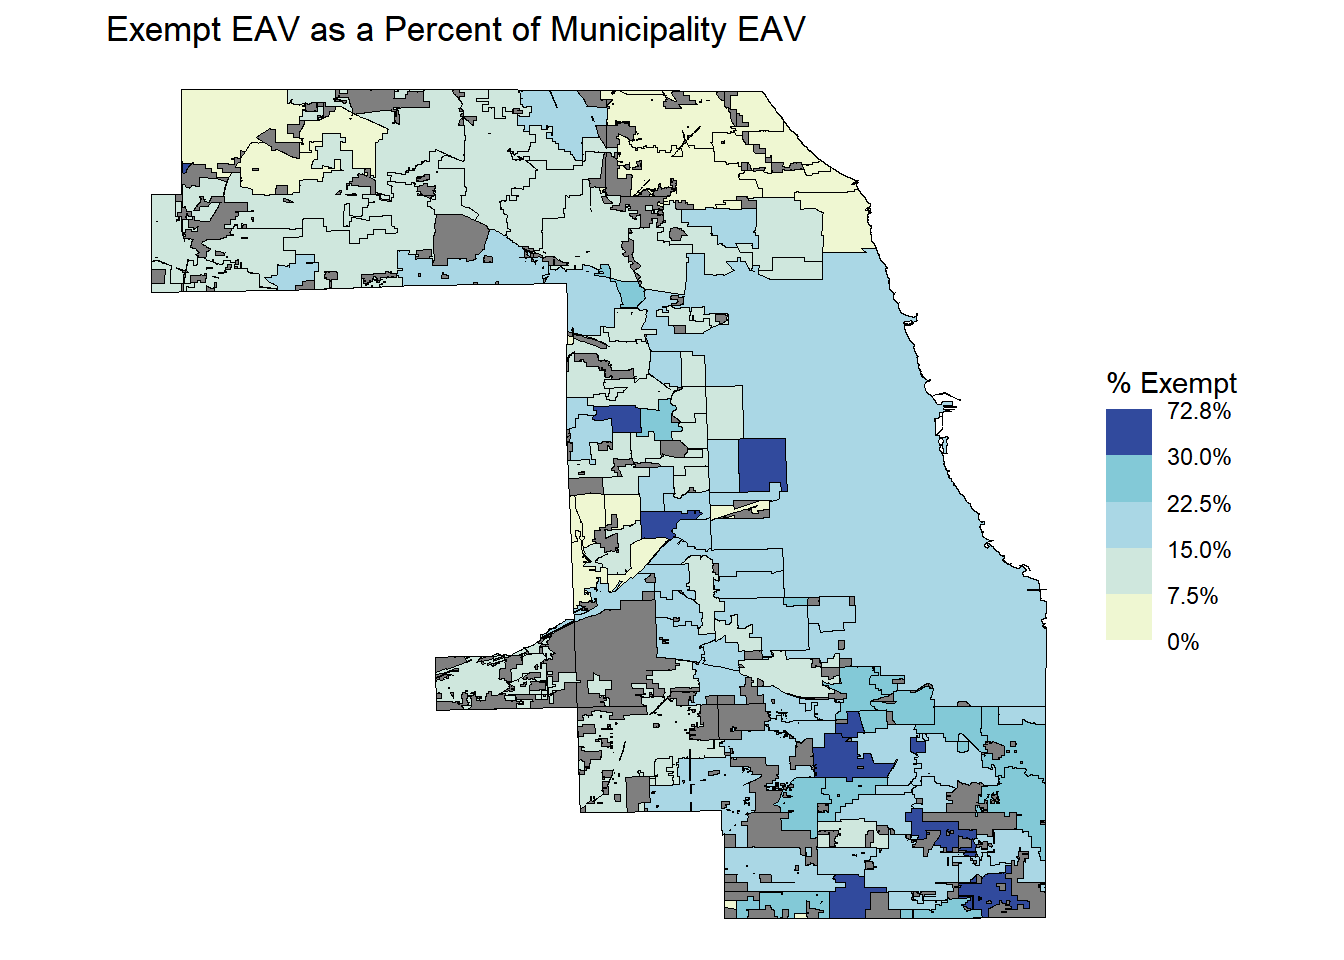
Figure 2.3: Share of FMV that is tax exempt due to Homestead Exemptions Same as previous image but in different color scheme that indicates high and low instead of using a midpoint for the color gradient.
The County-wide municipal-median percent of FMV exempt from property taxes in tax year 2022 was North Riverside with 13.68%.
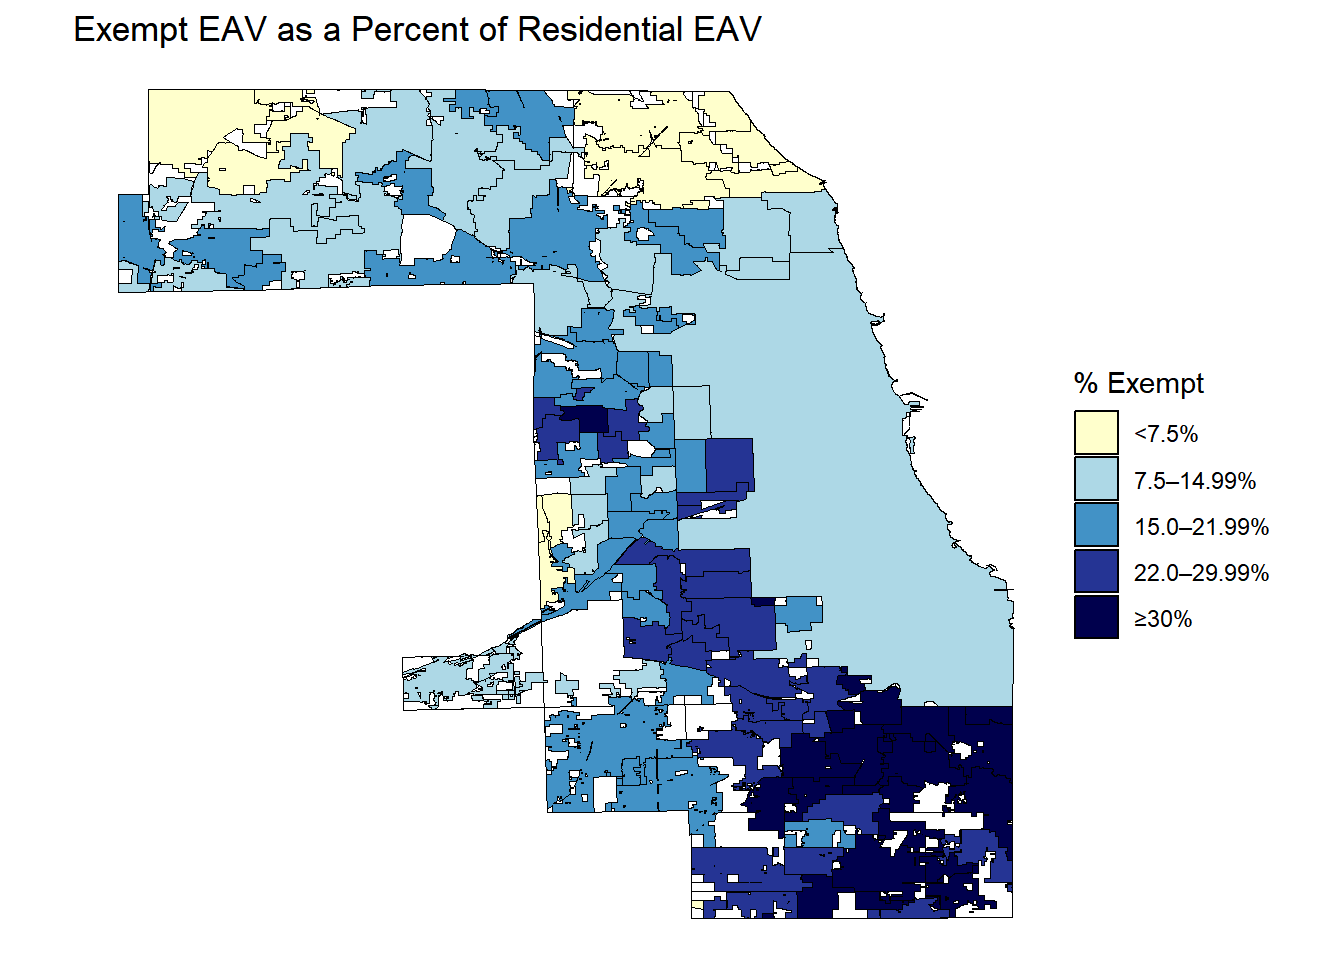
The percent of municipal EAV exempt from property taxes are greatest across Cook County’s south suburbs and lowest in the northern most suburbs of the county.
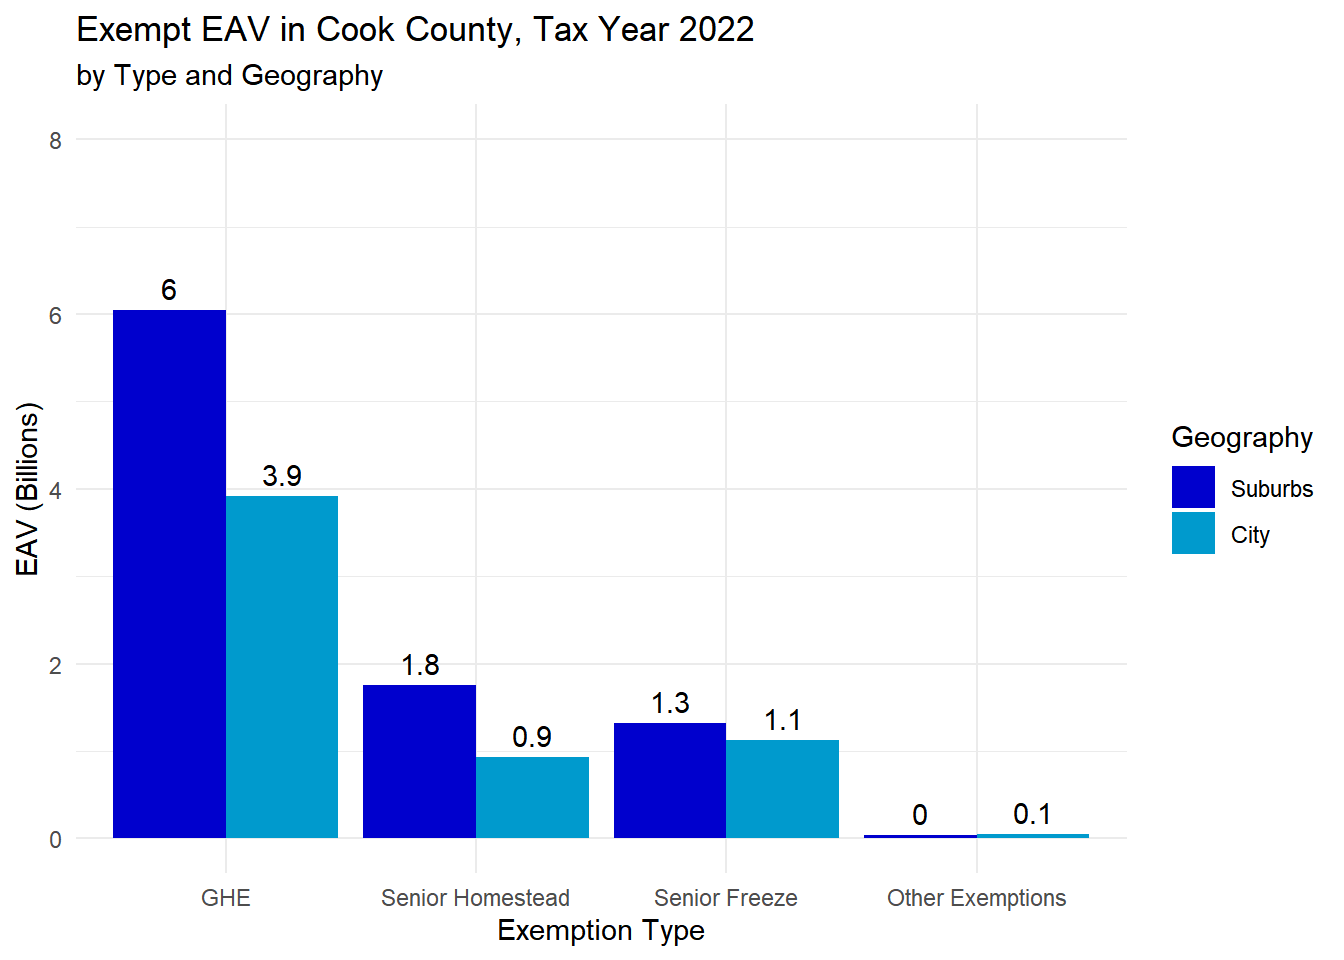
Figure 4. Exempt EAV: City vs. Suburbs
Code
## makes table in margin for suburbs and citygeom_sums <- muni_cl_sums |>filter(year == params$year) |>select(clean_name, muni_c_all_exemptions) |>mutate(clean_name =ifelse(is.na(clean_name), "Unincorporated", clean_name),Geography =ifelse(clean_name =="Chicago", "City", "Suburbs"),Geography =ifelse(is.na(clean_name), "Unincorporated", Geography),Geography =factor(Geography, levels =c("Suburbs", "City", "Unincorporated"))) |>group_by(Geography) |>summarize("ExemptEAV"=sum(muni_c_all_exemptions, na.rm=TRUE))geom_sums |>flextable() |> flextable::set_caption(caption ="Includes all exemption types.")
Geography
ExemptEAV
Suburbs
9,166,789,350
City
6,035,672,661
Code
muni_cl_sums |>filter(year == params$year) |>select(clean_name, muni_c_exe_homeowner:muni_c_exe_vet_dis) |>mutate(clean_name =ifelse(is.na(clean_name), "Unincorporated", clean_name),Geography =ifelse(clean_name =="Chicago", "City", "Suburbs"),Geography =ifelse(is.na(clean_name), "Unincorporated", Geography),Geography =factor(Geography, levels =c("Suburbs", "City", "Unincorporated"))) |>group_by(Geography) |>summarize("GHE"=sum(muni_c_exe_homeowner, na.rm=TRUE),"Senior Homestead"=sum(muni_c_exe_senior, na.rm=TRUE),"Senior Freeze"=sum(muni_c_exe_freeze, na.rm=TRUE),"Other Exemptions"=sum(muni_c_exe_longtime_homeowner+muni_c_exe_disabled+muni_c_exe_vet_returning+ muni_c_exe_vet_dis_lt50 + muni_c_exe_vet_dis_50_69+muni_c_exe_vet_dis_ge70)) |>pivot_longer(cols =c(`GHE`:`Other Exemptions`), names_to ="Type" ) |>mutate(Type =factor(Type, levels =c("GHE", "Senior Homestead", "Senior Freeze", "Other Exemptions"#"Senior Freeze", "Senior Homestead", "GHE" ) )) |>ggplot(aes(x=Type, y = value/1e9, fill = Geography )) +geom_col( position ="dodge" ) +geom_text(aes(label =round(value/1e9, digits=1)), vjust=-0.5, position =position_dodge(.9)) +theme_minimal() +labs(title =paste0("Exempt EAV in Cook County, Tax Year ", params$year), subtitle ="by Type and Geography", y ="EAV (Billions)", x ="Exemption Type") +scale_y_continuous(limits =c(0, 8)) +scale_fill_manual(values =c("blue3", "deepskyblue3", "gray") )
Figure 2.4: Exempt EAV in Cook County Exemption use varies between suburban Cook County and the City of Chicago which may point to broader socioeconomic patterns as well as residents’ eligibility and update. Note: Our current calculations undervalue the disabled veterans exemption.
Exemption use varies between suburban Cook County (9,166,789,350 EAV) and the City of Chicago (6,035,672,661 EAV) , which may point to broader socioeconomic patterns as well as residents’ eligibility and uptake.
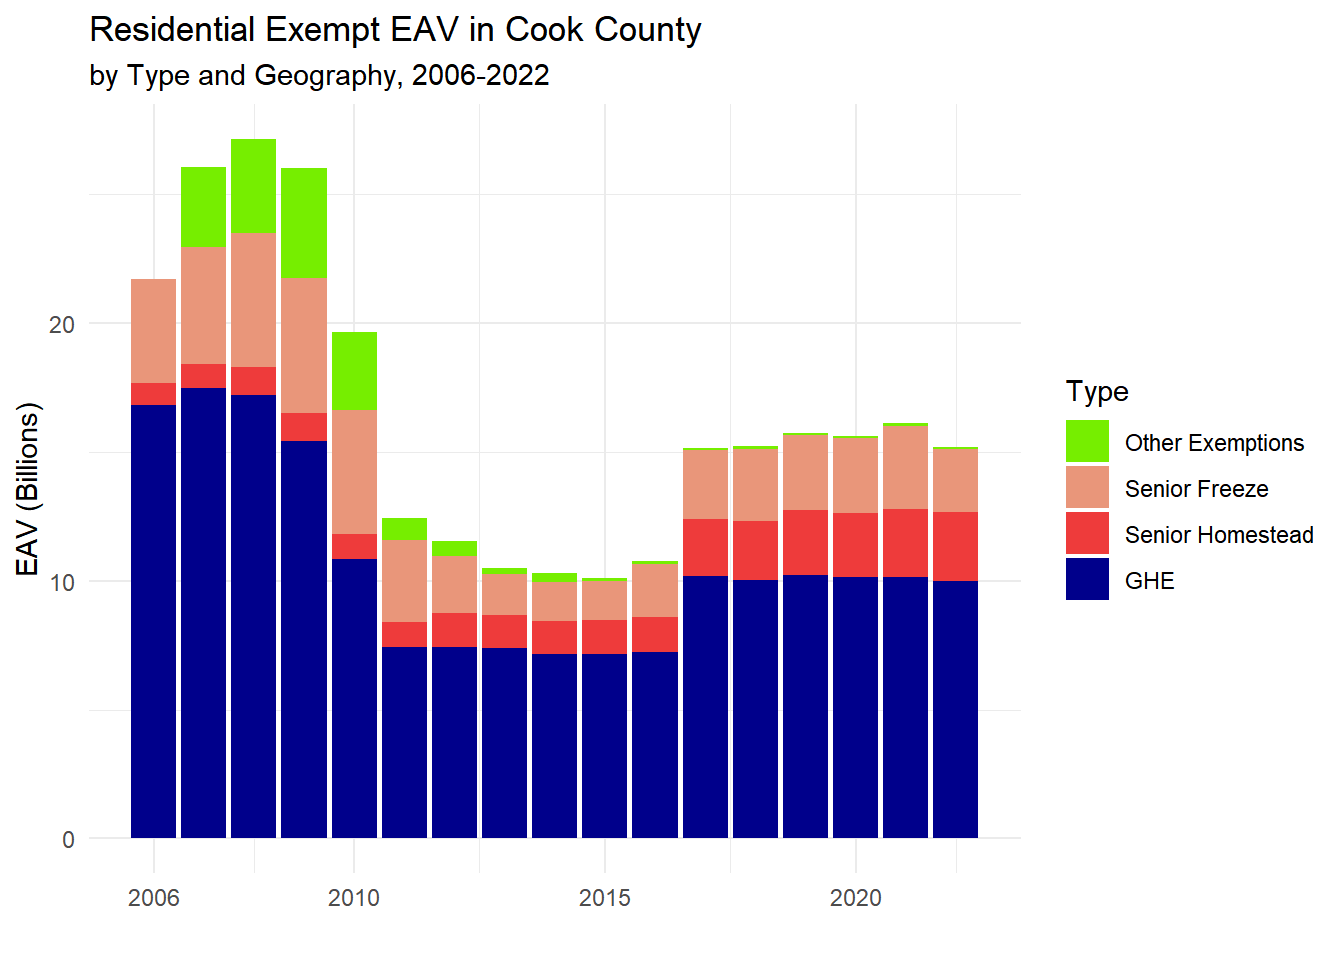
Figure 5. Value of residential exemptions by type in Cook County over time, Tax Years 2006 - 2022
Code
#county_sums |># filter(year == params$year) |>group_by(year) |>summarize('GHE'=sum(exempt_GHE_eav + exempt_LTHO_eav),'Senior homestead'=sum(exempt_SR_eav),'Senior freeze'=sum(exempt_FR_eav),# 'Other Exemps.' = sum(exempt_allexemptions_eav -exempt_GHE_eav - exempt_SR_eav - exempt_FR_eav), "Veterans (combined)"=sum(exempt_VET_eav, na.rm = T),"Persons with disabilities"=sum(exempt_DIS_eav, na.rm=T),# "Other Exemptions" = sum(muni_c_exe_disabled + muni_c_exe_vet_returning+ muni_c_exe_vet_dis_lt50 + muni_c_exe_vet_dis_50_69+muni_c_exe_vet_dis_ge70, na.rm = T)) |>pivot_longer(cols =c(`GHE`:`Persons with disabilities`), names_to ="Type" ) |>mutate(Type =factor(Type, levels =c("Persons with disabilities", "Veterans (combined)", "Senior freeze", "Senior homestead", "GHE"))) |>ggplot(aes(x=year, y = value/1000000000, fill = Type)) +geom_bar( stat ="identity" ) +theme_minimal() +labs(title ="Residential Exempt EAV in Cook County", subtitle =paste0("by Type and Geography, 2006-", params$year), y ="EAV (Billions)", x ="") +scale_fill_manual(values =c("deepskyblue3", "chartreuse2", "darksalmon", "brown2", "blue4" )) +scale_x_continuous(breaks =c(2006, 2010, 2015, 2020, 2023))
Figure 2.5: Residential Exempt EAV in Cook County
Trends in the total EAV reductions due to homestead exemptions reflect both real estate market shifts and the legislative changes in their availability, eligibility, and value.
Effect on Composite Tax Rates
Figure 6 will not be recreated but is just a bar chart of the change in tax rate in the table below
Table 1. Change in composite property tax rates due to exemptions, tax year 2022.
Code
muni_ratechange <-read_csv(paste0("../Output/muni_ratechange_", params$year, ".csv"))muni_ratechange |>select(clean_name, current_rate_avg, rate_noExe, change_noExe, final_tax_to_dist) |>mutate(change_noExe =round(change_noExe *100, digits =2)) |> DT::datatable(rownames =FALSE, colnames =c('Municipality'='clean_name','Current Comp. Rate'='current_rate_avg', 'Hypothetical Rate'='rate_noExe', 'Composite Tax Rate Change'='change_noExe', 'Composite Levy'='final_tax_to_dist'),caption ="Table 1 in Report for all Municipalities: Current and Hypothetical Composite Tax Rates if GHE $0") |>formatCurrency('Composite Levy', digits =0) |>formatPercentage(columns =c(2,3), digits =2)
Table 2.2: Searchable table containing all municipalities and the hypothetical tax rate change if exempt EAV became taxable.
Table 2.3: Table 1 in Exemption Report. Shows the top 5, bottom 5, and median 5 municipalities, ranked by change in composite tax rate. Includes all exemption types in calculation of rate change.
Municipality
With Exemptions
Without Exemptions
Percent Point Difference
Park Forest
43.60
20.08
22.97
Phoenix
30.77
11.40
19.30
Riverdale
32.68
20.38
11.91
Dolton
26.68
15.43
10.95
Hazelcrest
26.46
14.79
10.87
Streamwood
10.27
7.91
2.36
La Grange Park
10.81
8.43
2.27
Forest Park
12.26
9.92
2.24
Indian Head Park
8.97
6.78
2.23
Merrionette Park
12.03
9.80
2.23
Northfield
7.12
6.55
0.52
Hinsdale
8.07
7.57
0.50
Glencoe
7.82
7.42
0.40
Kenilworth
8.09
7.72
0.36
Winnetka
7.47
7.11
0.35
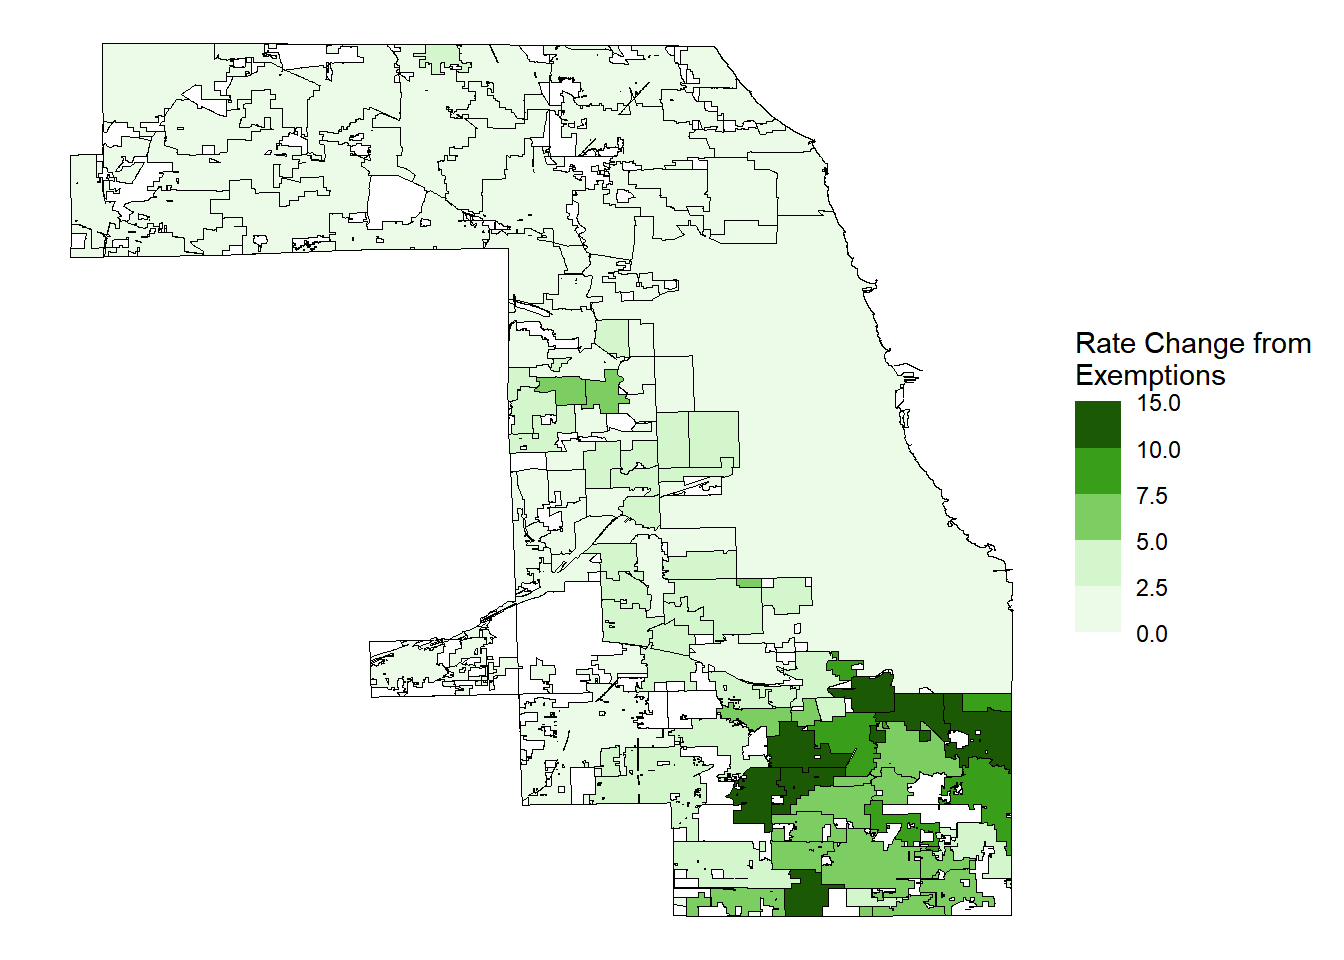
Figure 7. Map of Spatial Patterns in Composite Tax Rate Change
Change in composite tax rate if exempt EAV was added back to the the taxable tax base (i.e. if there were no exemptions).
Code
muni_ratechange |>mutate(across(c(current_rate_avg, rate_noExe, change_noExe ), ~.*100)) |>left_join(nicknames, by ="clean_name") |>mutate(agency_name =ifelse(agency_name =="TOWN CICERO", "CITY OF CICERO", agency_name),shpfile_name =ifelse(agency_name =="TOWN CICERO", "CITY OF CICERO", agency_name) ) |>full_join(muni_shp, by =c("agency_name"="AGENCY_DESC")) |>ggplot(aes(fill = change_noExe)) +geom_sf(aes(geometry = geom), color ="black") +theme_void() +theme(axis.ticks =element_blank(), axis.text =element_blank())+scale_fill_stepsn(colors =c( "#F7FEF5",# "#e4f1e0","#d4f6cc","#47ba24","#1F6805","#133C04"),show.limits=TRUE, limits =c(0, 15),breaks =c(0, 2.5, 5, 7.5, 10, 15),na.value =NA,name ="Rate Change from \nExemptions" )
Code
order <- burden_shift %>%as_tibble() %>%group_by(agency_name, clean_name) %>%summarize(tax_rate_current =median(tax_rate_current), taxrate_new =median(taxrate_new),taxrate_change =median(taxrate_change)) %>%arrange(taxrate_change)median(order$taxrate_change)burden_shift %>%filter(taxrate_change <0.0027|taxrate_change >0.06| taxrate_change < (median(taxrate_change))+0.0007& taxrate_change > (median(taxrate_change))-0.00075 ) %>%filter(Alea_cat =="Owner Occupied") %>%# filter(PropType == "Single-Family") %>%ungroup() %>%select(clean_name, tax_rate_current, taxrate_new, agency_name) %>%pivot_longer(c("tax_rate_current", "taxrate_new"), names_to ="type", values_to ="tax_rate") %>%left_join(order) %>%ggplot(aes(x = tax_rate*100, y=reorder(clean_name, taxrate_change)))+geom_line(aes(group = clean_name))+geom_point(aes(color=type), size=3 )+geom_hline(yintercept =10.5, linetype =2)+geom_hline(yintercept =5.5, linetype =2)+theme_minimal() +theme( legend.title =element_blank(),plot.title.position ="plot",legend.position ="none",# panel.background = element_rect(fill='transparent'), #transparent panel bgplot.background =element_rect(fill='transparent', color=NA) #transparent plot bg )+scale_color_brewer(palette="Paired", labels =c("Exemptions", "No Exemptions"), direction =1)+labs(title ="Difference in Composite Tax Rate if there were No Exemptions", subtitle ="Ordered by Change in Tax Rate: Highest, Median, and Smallest Differences",caption ="Median change is 1.38 percentage points",x ="Composite Tax Rate (%)", y ="" )
Effect on Tax Burdens
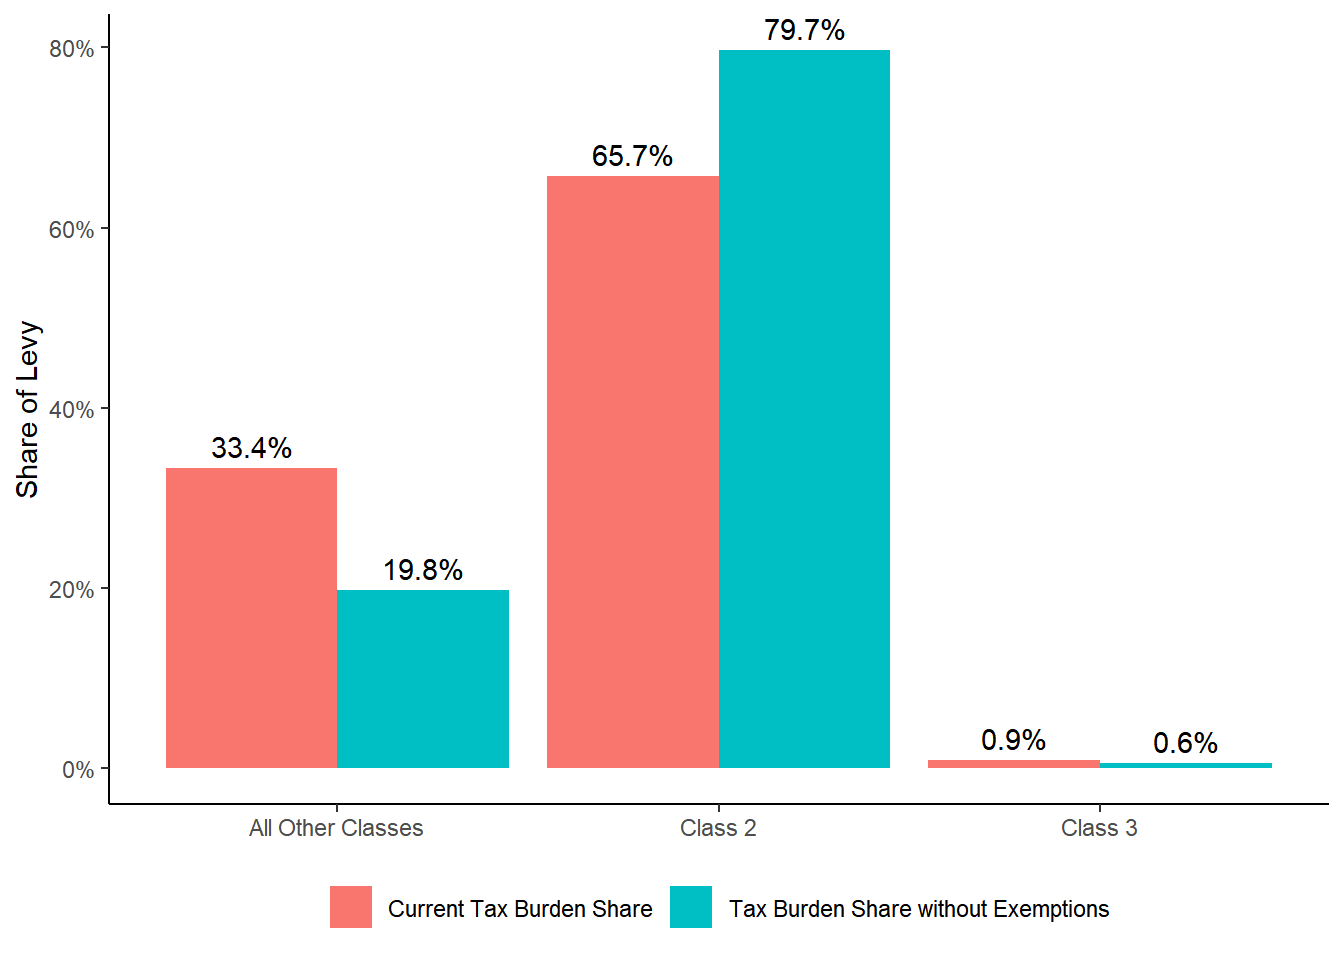
Figure 8. Dolton example of Share of levy paid by property type
Table 2.4: Ungrouped values for donut chart in report. Tax Burden is the Revenue Collected from a Major Class / the combined levy from local taxing agencies (non-TIF) in Dolton, IL.
Major Class
Current Tax Burden
Alt. Burden
2
65.69
79.69
5
29.42
17.45
1
1.67
0.98
8
1.28
0.75
3
0.95
0.56
6
0.56
0.33
9
0.37
0.22
4
0.07
0.04
0
0.00
0.00
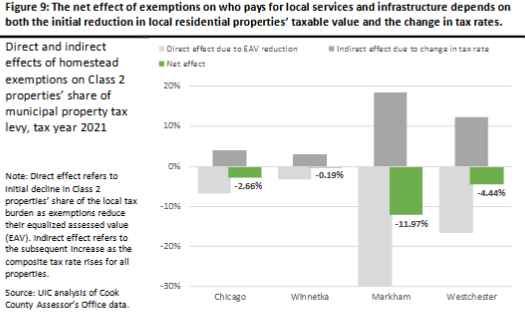
Figure 9. Change in Share of Tax Burden
Was made in Excel. Not recoded for website yet.
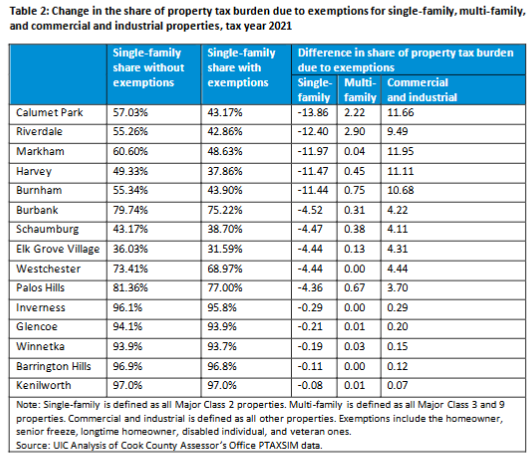
Table 2. Change in share of property tax burden
Table 2: Change in the share of property tax burden due to exemptions for single-family, multi-family, and commercial and industrial properties, tax year 2022
Table 2.5: Supporting Table for Table 2 Change in tax burden if EAV that is current tax exempt due to homestead exemptions became taxable. Measured in percentage point change.
Code
burden_c2 |>mutate(burden_shift = burden_shift*100) |># multiply by 100 to make it percentage point change without formatting to percent below.datatable(rownames =FALSE,colnames =c('Municipality'='clean_name', 'Burden Shift, Pct Pt Change'='burden_shift', 'Current Tax Burden\nC2 Tax Collected / Muni Levy'='pct_taxburden_current', "Hypothetical Tax Burden\nHyp. C2 Tax Collected / Muni Levy"='hyp_pct_taxburden'),caption ="Table 2 in Exemption Report: Current Share of Taxable EAV and Share of Levy Paid by Class 2 Properties" ) |>formatPercentage(c(2,3,4), digits =2) |>formatRound(c(2), digits =2)
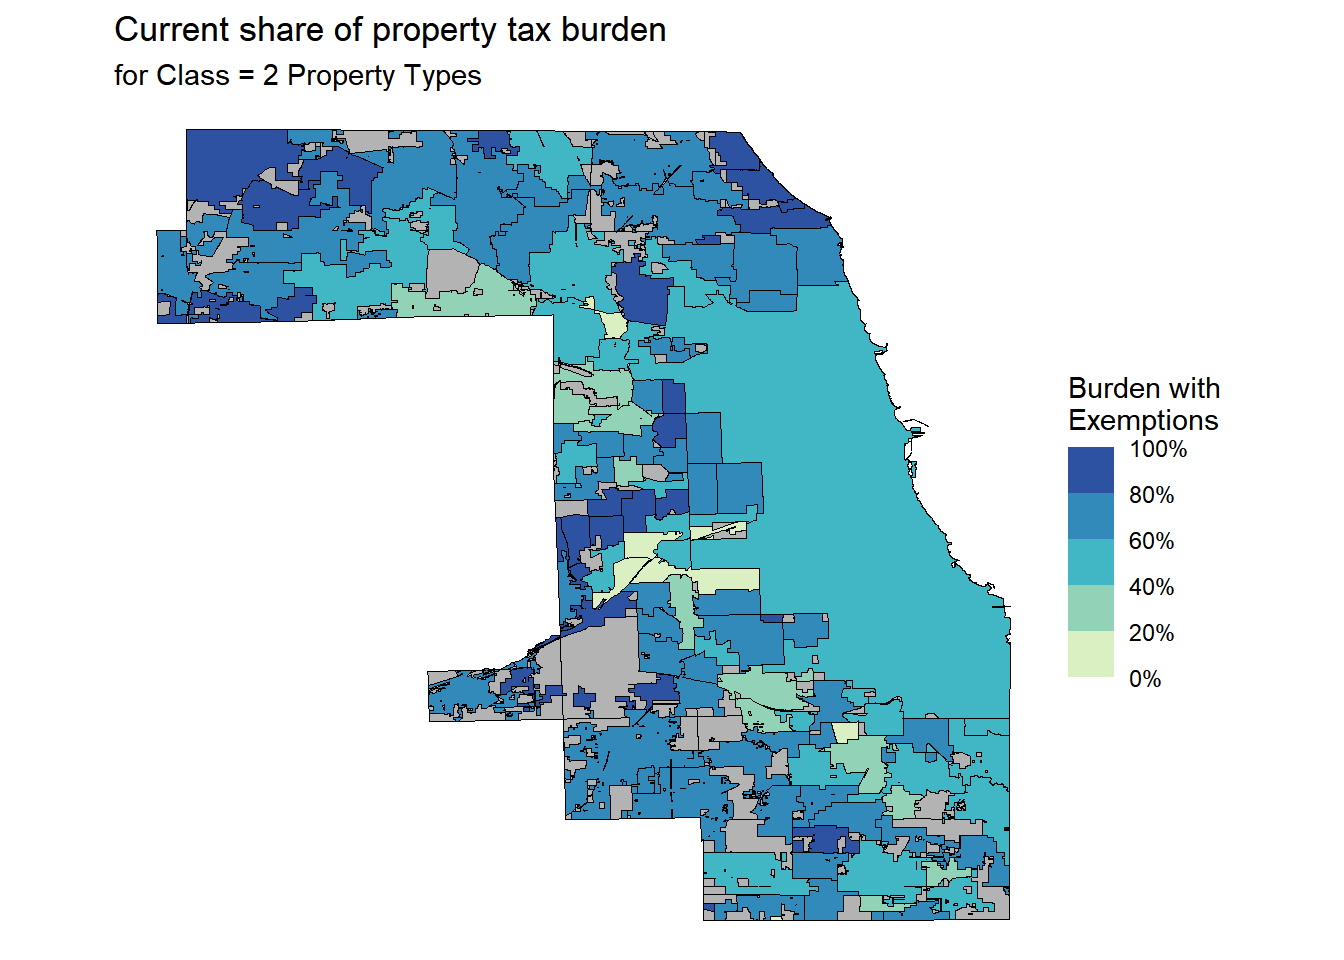
Figure 9 Follow up. Current Tax Burden Map
Code
burden_c2 |>left_join(nicknames) |>mutate(agency_name =ifelse(agency_name =="TOWN CICERO", "CITY OF CICERO", agency_name) ) |>full_join(muni_shp, by =c("agency_name"="AGENCY_DESC")) |>ggplot(aes(fill = pct_taxburden_current)) +geom_sf(aes(geometry = geom), color ="black") +theme_void() +theme(axis.ticks =element_blank(), axis.text =element_blank())+scale_fill_stepsn(colors =c("#ffffcc","#a1dab4" ,"#41b6c4","#2c7fb8", "#253494"),show.limits=TRUE, limits =c(0,1),na.value ="gray70",n.breaks =6,name ="Burden with \nExemptions", labels = scales::percent )+labs(title ="Current share of property tax burden", subtitle ="for Class = 2 Property Types")
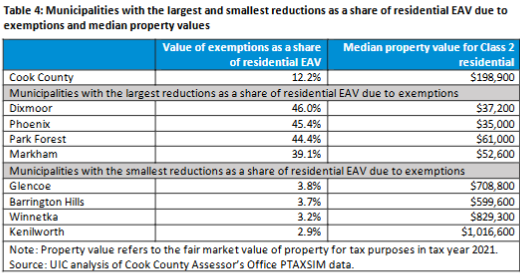
Table 3.
Difference in taxbills for those that do and do not claim homeowner exemption
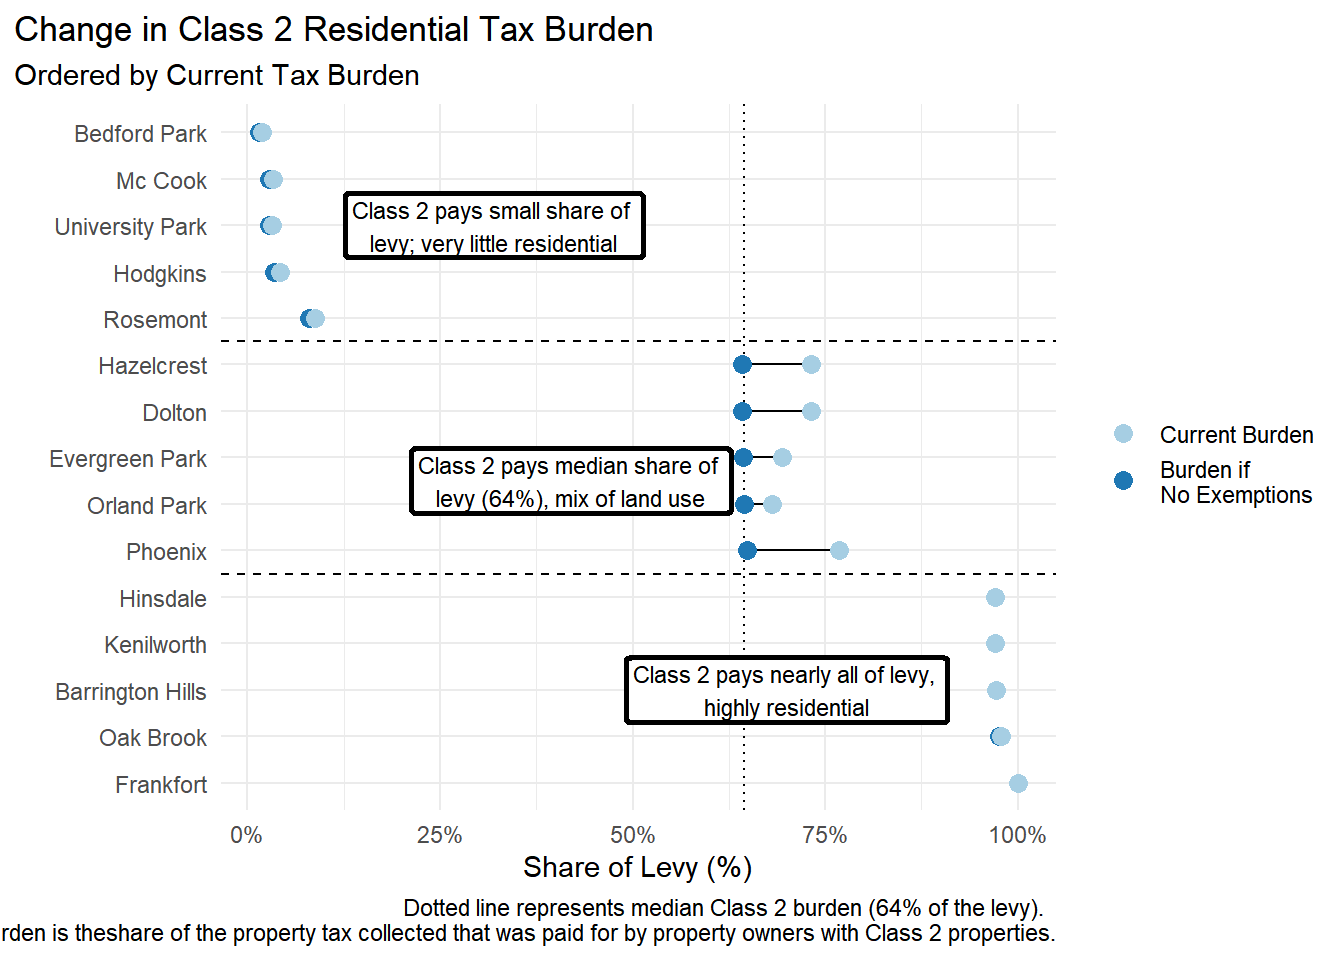
Share of municipal property tax levy paid by Class 2 properties with and without homestead exemptions, tax year 2022
Code
# as a dot graph ## order <- mc_burden |>filter(class_1dig ==2) |>select(clean_name, pct_taxburden_current, burden_shift)slice <- mc_burden |>filter(class_1dig ==2) |>select(clean_name, pct_taxburden_current, burden_shift) |>arrange(pct_taxburden_current) |>slice(1:5, 63:67, 127:131)median_burden <-median(order$pct_taxburden_current)median_shift <-median(order$burden_shift)# median burden change is 5.9 percentage points# current median burden is 70.3% of the levymc_burden |>filter(clean_name %in% slice$clean_name) |>#filter(!clean_name %in% cross_county_lines$clean_name)|>filter(class_1dig ==2) |># filter(burden_current > 0.938 |burden_current < .17 |# ( (burden_current < median(burden_current) + 0.01 )& (burden_current > median(burden_current) - 0.01)) )|> ungroup() |>select(clean_name, pct_taxburden_current, hyp_pct_taxburden, burden_shift) |>arrange(burden_shift) |>pivot_longer(c("pct_taxburden_current", "hyp_pct_taxburden"), names_to ="type", values_to ="pct_burden") |>inner_join(order) |>ggplot(aes(x = pct_burden, y=reorder(clean_name, - pct_taxburden_current)))+# y= reorder(clean_name, burden_current)))+geom_vline(xintercept = median_burden, linetype =3)+geom_line(aes(group = clean_name))+geom_hline(yintercept =5.5, linetype =2)+geom_hline(yintercept =10.5, linetype =2)+geom_point(aes(color=type), size=3 )+theme_minimal() +theme( legend.title =element_blank(),plot.title.position ="plot",plot.background =element_rect(fill='transparent', color=NA) )+scale_color_brewer(palette="Paired", labels =c("Current Burden", "Burden if \nNo Exemptions" ), direction =1) +scale_x_continuous(labels = scales::percent) +labs(title ="Change in Class 2 Residential Tax Burden", subtitle ="Ordered by Current Tax Burden",x ="Share of Levy (%)", y ="" , caption =paste0("Dotted line represents median Class 2 burden (", round(median_burden*100), "% of the levy). \nResidential Tax Burden is theshare of the property tax collected that was paid for by property owners with Class 2 properties.")) +geom_label(label ="Class 2 pays small share of \nlevy; very little residential", x=.32, y =13, label.size =1, size =3)+geom_label(label =paste0("Class 2 pays median share of \nlevy (", round(median_burden*100), "%), mix of land use"), x=.42, y =7.5, label.size =1, size =3) +geom_label(label ="Class 2 pays nearly all of levy, \nhighly residential", x=.70, y =3, label.size =1,size =3)
Figure 2.6
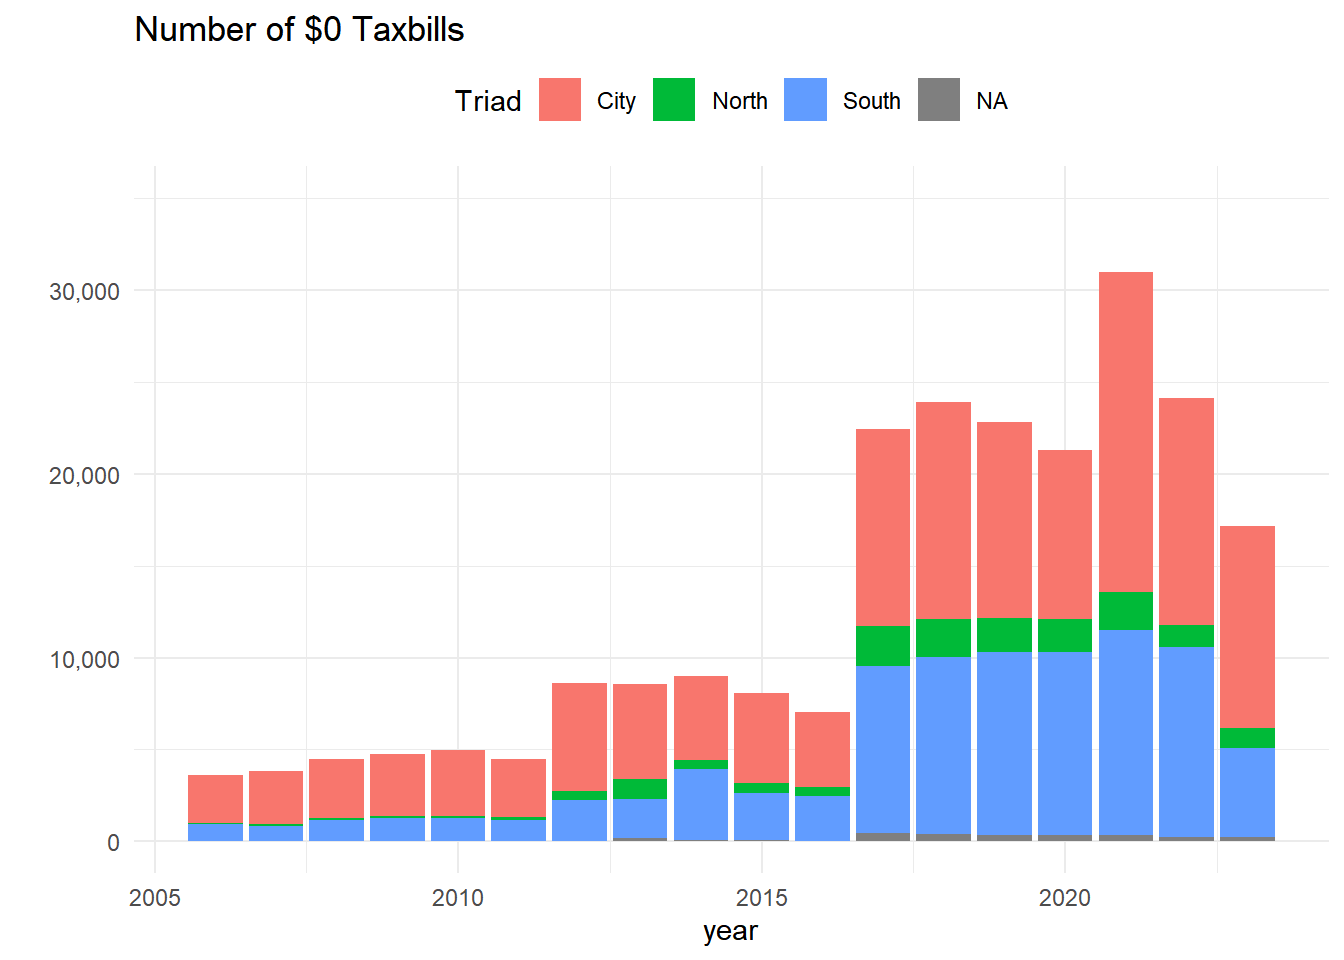
Figure 11. Zero Dollar Bills
Code
muni_mc_sums |>left_join(nicknames) |>filter(major_class_code ==2) |>group_by(year, Triad) |>summarize(zerodollar_count =sum(zero_bill)) |>ggplot(aes(x=year, y = zerodollar_count, fill = Triad)) +geom_bar(position ="stack", stat ="identity") +theme_minimal()+theme(legend.position ="top")+labs(title =element_text("Number of $0 Taxbills")) +scale_y_continuous(labels = scales::comma, limits =c(0, 35000), name ="")
Figure 2.7: Number of tax bills that were $0 shown here is different than the value shown in the exemption report. This is due to missing disabeled veteran exemption amounts that were not identified when writing the original report.
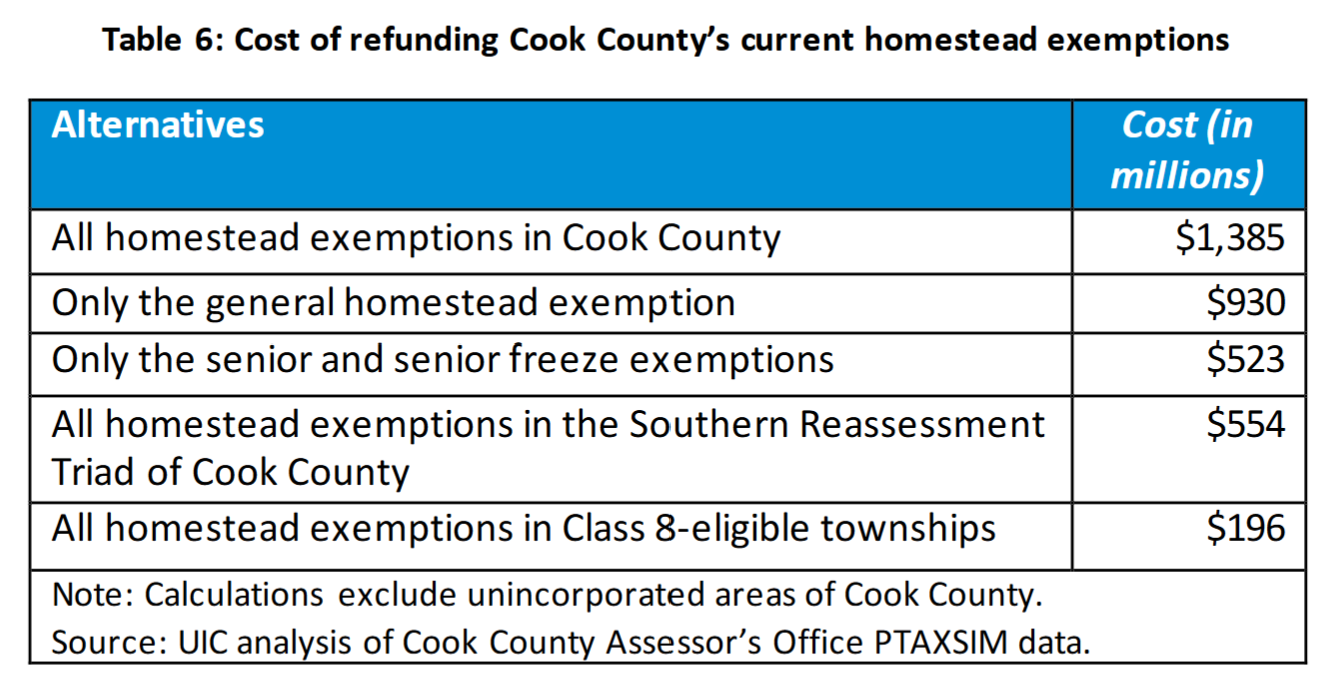
Table 6 - Cost of Covering Cook County’s current Homestead Exemptions