knitr::opts_chunk$set(warning =FALSE, message =FALSE)options(scipen =999)library(tidyverse)library(glue)library(sf)library(DT)library(flextable)nicknames <- readxl::read_excel("../Necessary_Files/muni_shortnames.xlsx")cook_sums <-read_csv("../Output/ptaxsim_cook_level_2006to2023_new.csv") muni_shp <-read_sf("../Necessary_Files/muni_shp.gpkg")knitr::opts_chunk$set(warning =FALSE, message =FALSE)set_flextable_defaults(theme_fun = theme_vanilla, padding =2,line_spacing =1,big.mark =",", )options(DT.options =list())FitFlextableToPage <-function(ft, pgwidth =6){ ft_out <- ft %>%autofit() ft_out <-width(ft_out, width =dim(ft_out)$widths*pgwidth /(flextable_dim(ft_out)$widths))return(ft_out)}# Create an empty data frame with a column named "year"params <-data.frame(year =numeric(0))# Add the value 2021 to the "year" columnparams <-rbind(params, data.frame(year =2023))min_year =min(cook_sums$year)max_year =max(cook_sums$year)cmap_colors =c("#1e478e", "#6dae4f", "#d3b42b", "#008fd5", "#ca3428", "#ade0ee", "#3e6730", "#d0e4a4")alea_theme <-function() { font <-"Whitney" ggplot2::theme(legend.position ="bottom",# legend.title = element_blank,panel.background = ggplot2::element_blank(),panel.grid.minor.x = ggplot2::element_blank(),panel.grid.major.y =element_line(color ="grey"),panel.grid.minor.y =element_line(color ="grey", linetype ="dashed"),# panel.grid.major.x = ggplot2::element_blank(),axis.ticks =element_line(color ="gray"),axis.ticks.x =element_blank() )}
Time Trends - All Years
The file comm_ind_inmunis_timeseries_2006to2023.csv contains all PINs that had an incentive property class for at least 1 year. It includes all observations for a property during the years that it existed, even if it is not an incentive class property in that year.
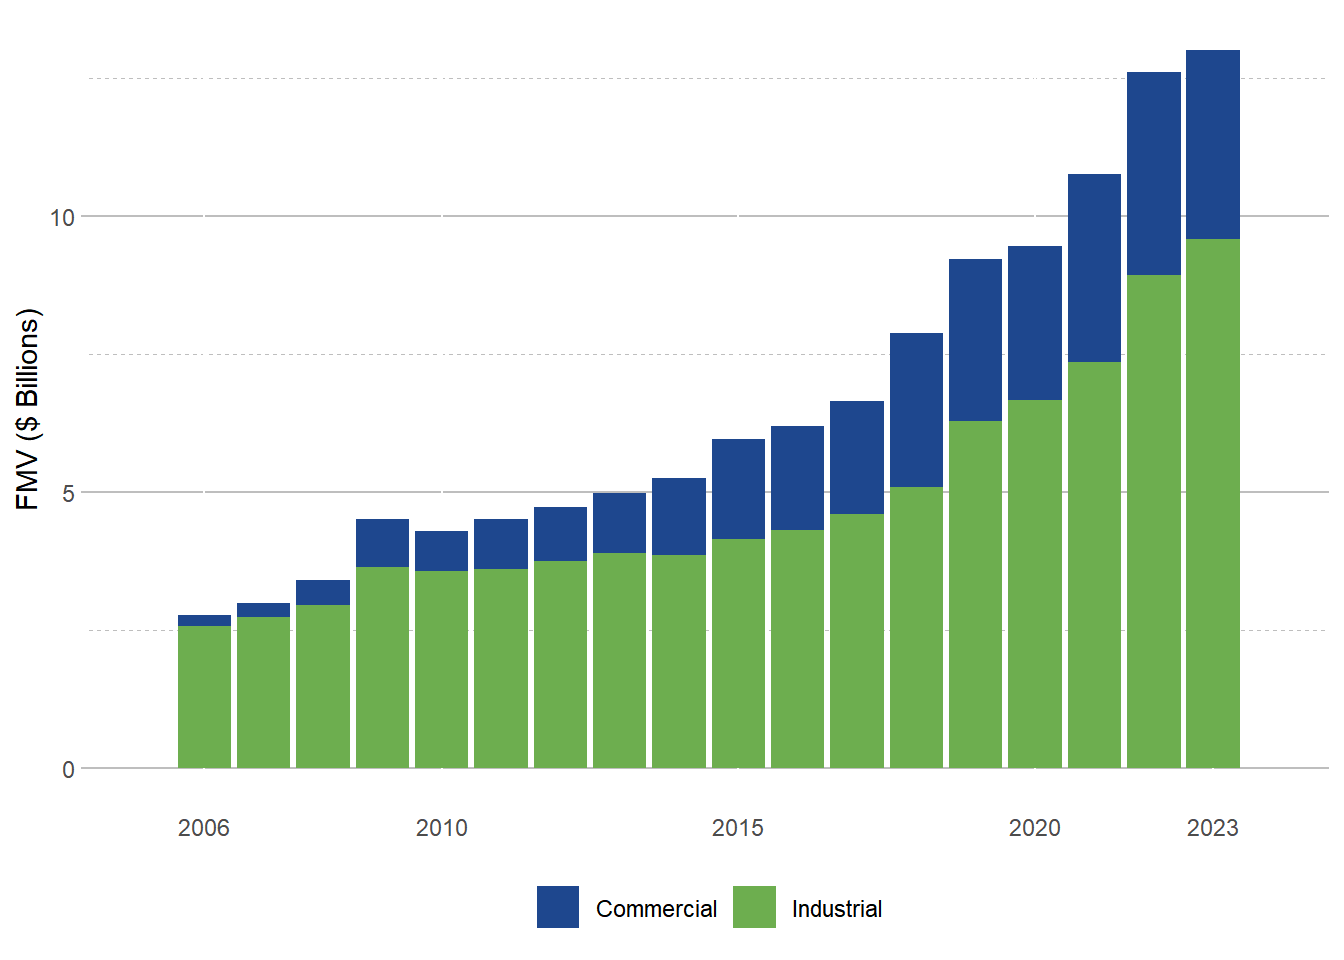
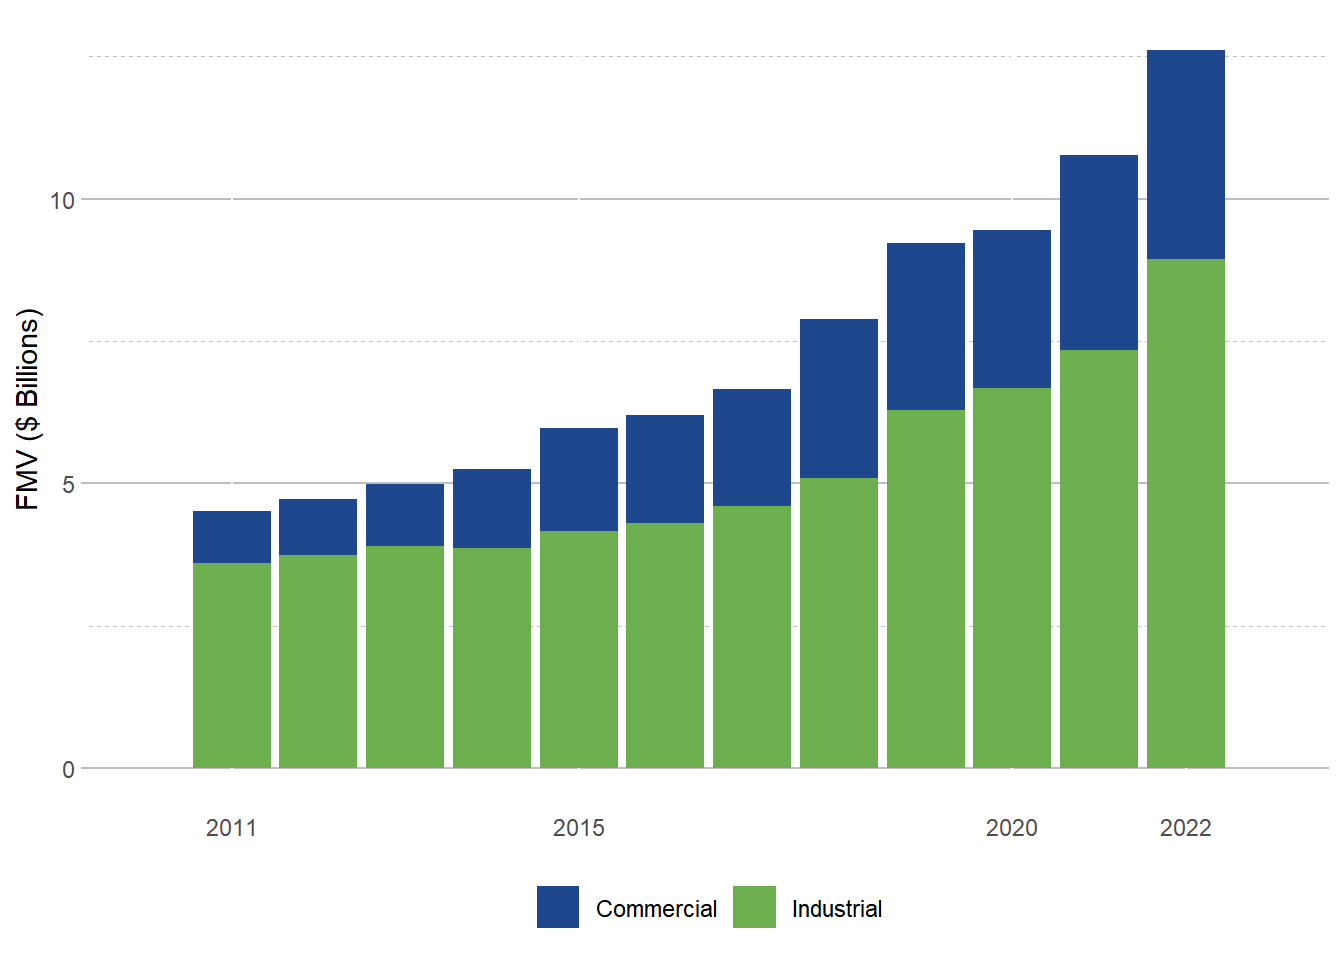
Figure 7.1: Similar to Figure 2 in Incentive Report Incentive FMV by Year, All Years
Code
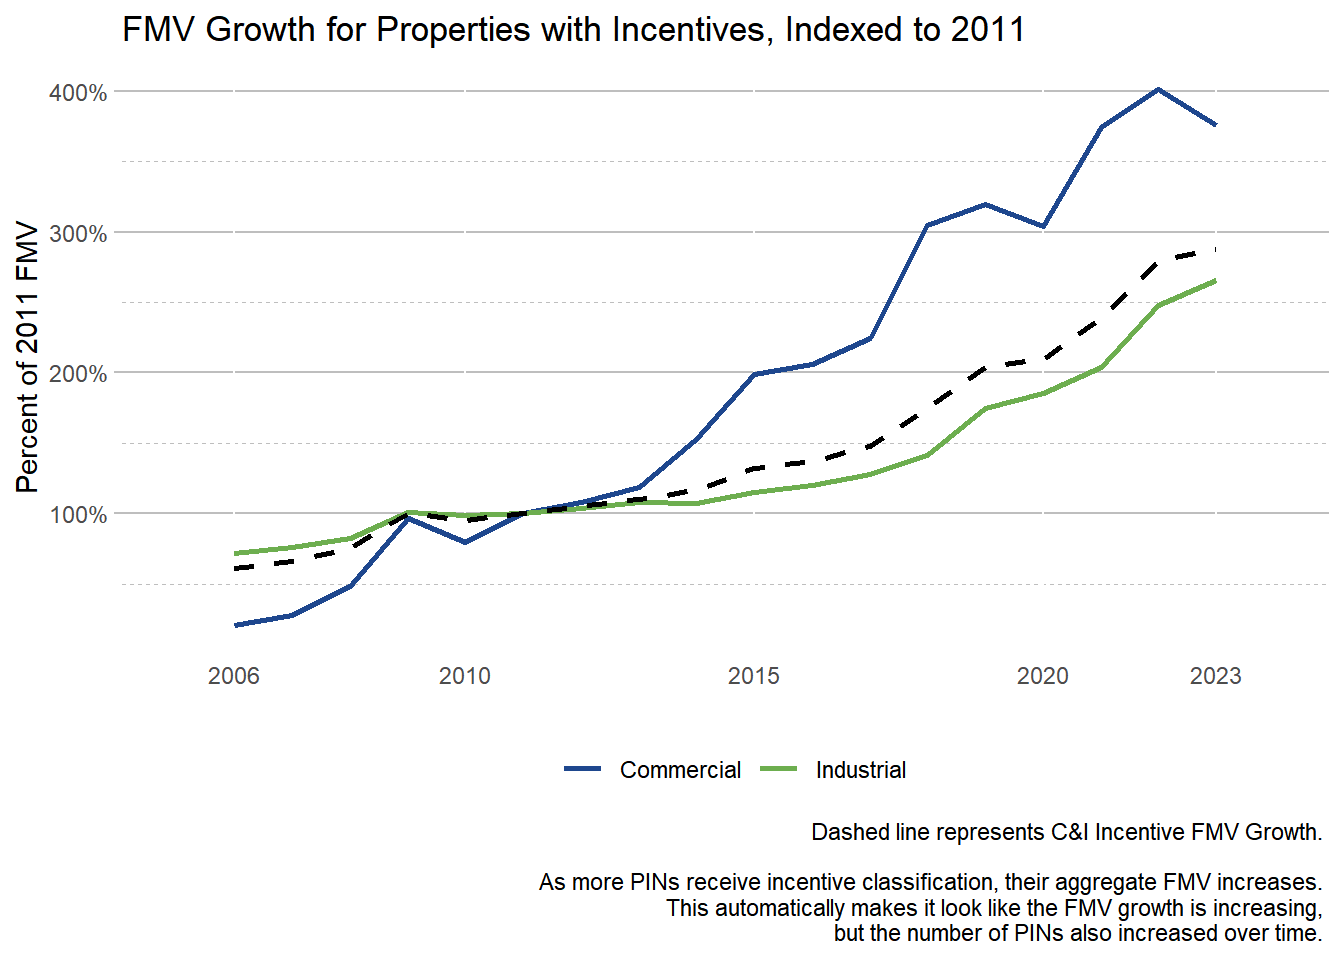
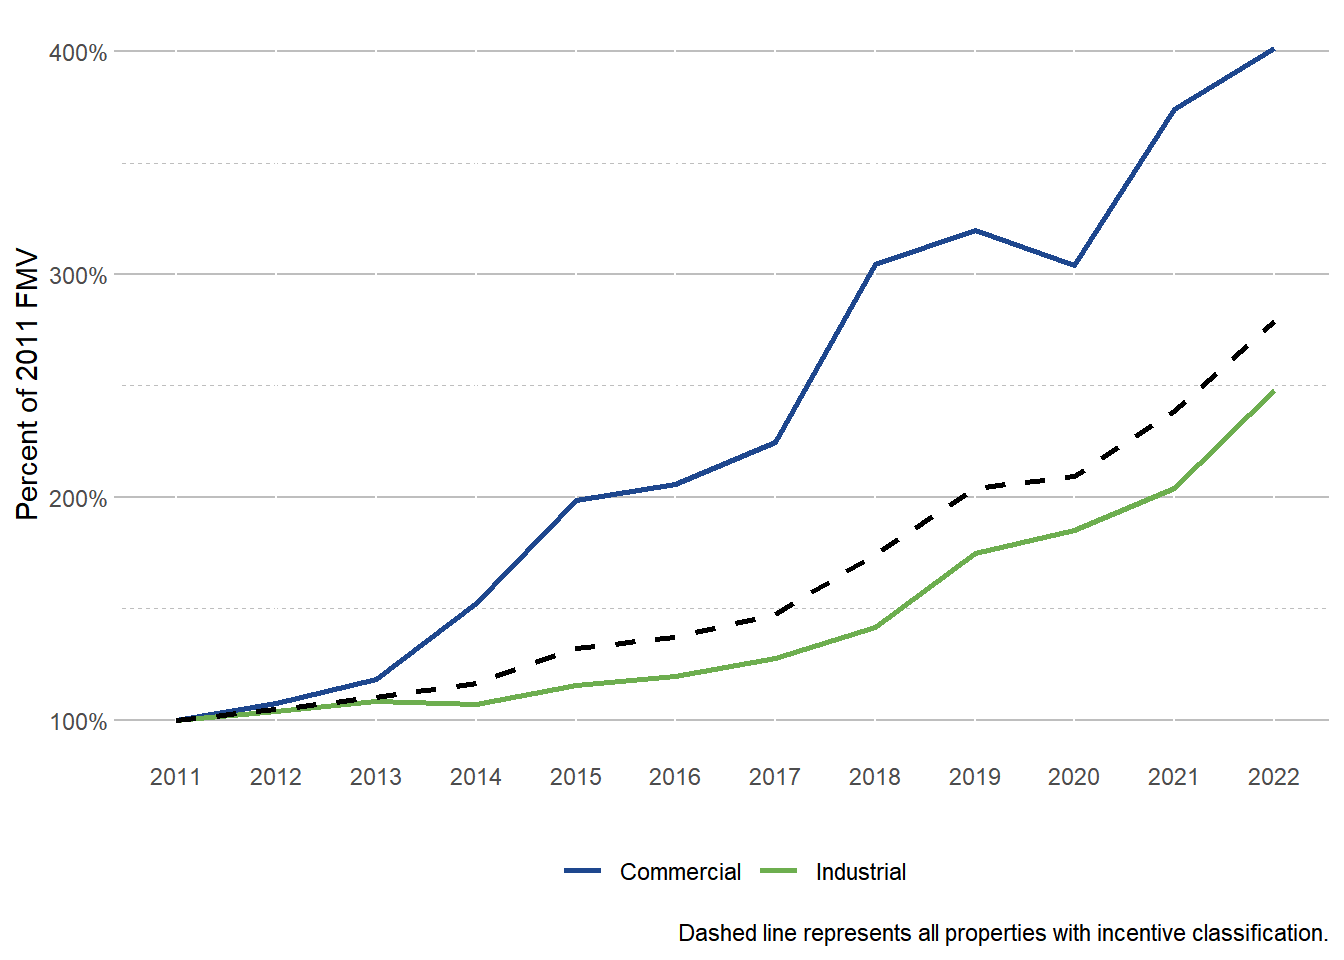
Appendix_Figure_FMVgrowth_allyears <- comm_ind_pins %>%filter(incent_prop =="Incentive") %>%reframe(fmv,type_fmv =sum(fmv, na.rm=TRUE), .by =c(year,land_use) ) %>%reframe(land_use, type_fmv,fmv_incent =sum(fmv, na.rm=TRUE), .by=year) %>%distinct() %>%arrange(year) %>%group_by(land_use) %>%mutate(ratio_2011 = type_fmv/ type_fmv[year==2011],ratio_both_2011 = fmv_incent/fmv_incent[year==2011]) Appendix_Figure_FMVgrowth_allyears %>%ggplot() +scale_color_manual(values =c("#1E478E", "#6DAE4F", "#D0E4A4") )+geom_line(aes(x=year, y = ratio_2011, group = land_use, color = land_use, ), lwd =1) +geom_line(aes(x=year, y =ratio_both_2011), lty =2, lwd=1 ) +scale_y_continuous(labels= scales::percent) +scale_x_continuous(limits =c(min_year -1, max_year +1), breaks =c(min_year, 2010, 2015, 2020, max_year)) +alea_theme() +labs(title ="FMV Growth for Properties with Incentives, Indexed to 2011", color =element_blank(),x =element_blank(), y ="Percent of 2011 FMV",caption ="Dashed line represents C&I Incentive FMV Growth. \n As more PINs receive incentive classification, their aggregate FMV increases. This automatically makes it look like the FMV growth is increasing, but the number of PINs also increased over time. ")
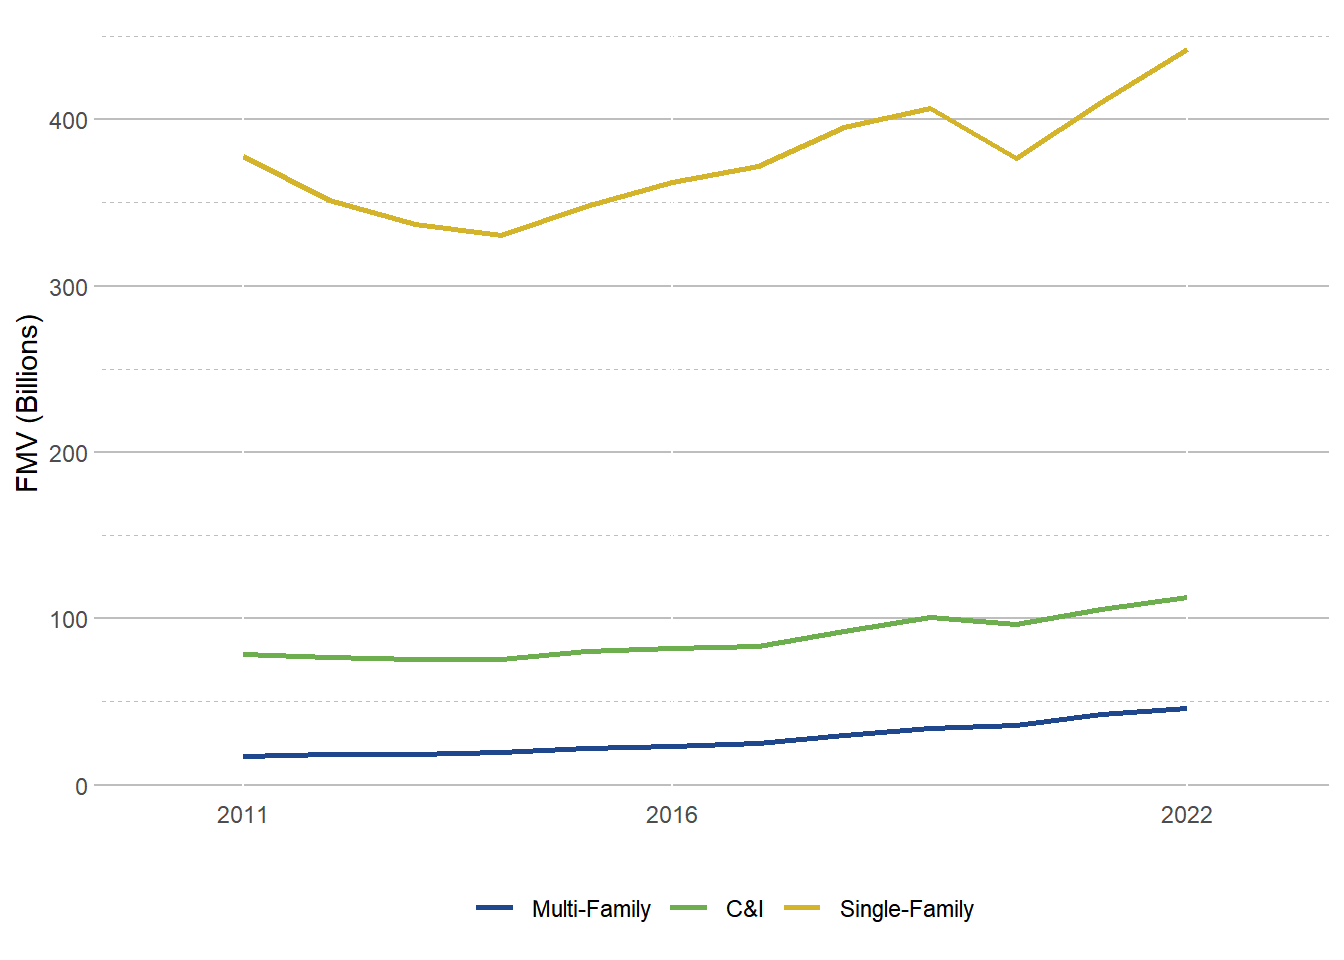
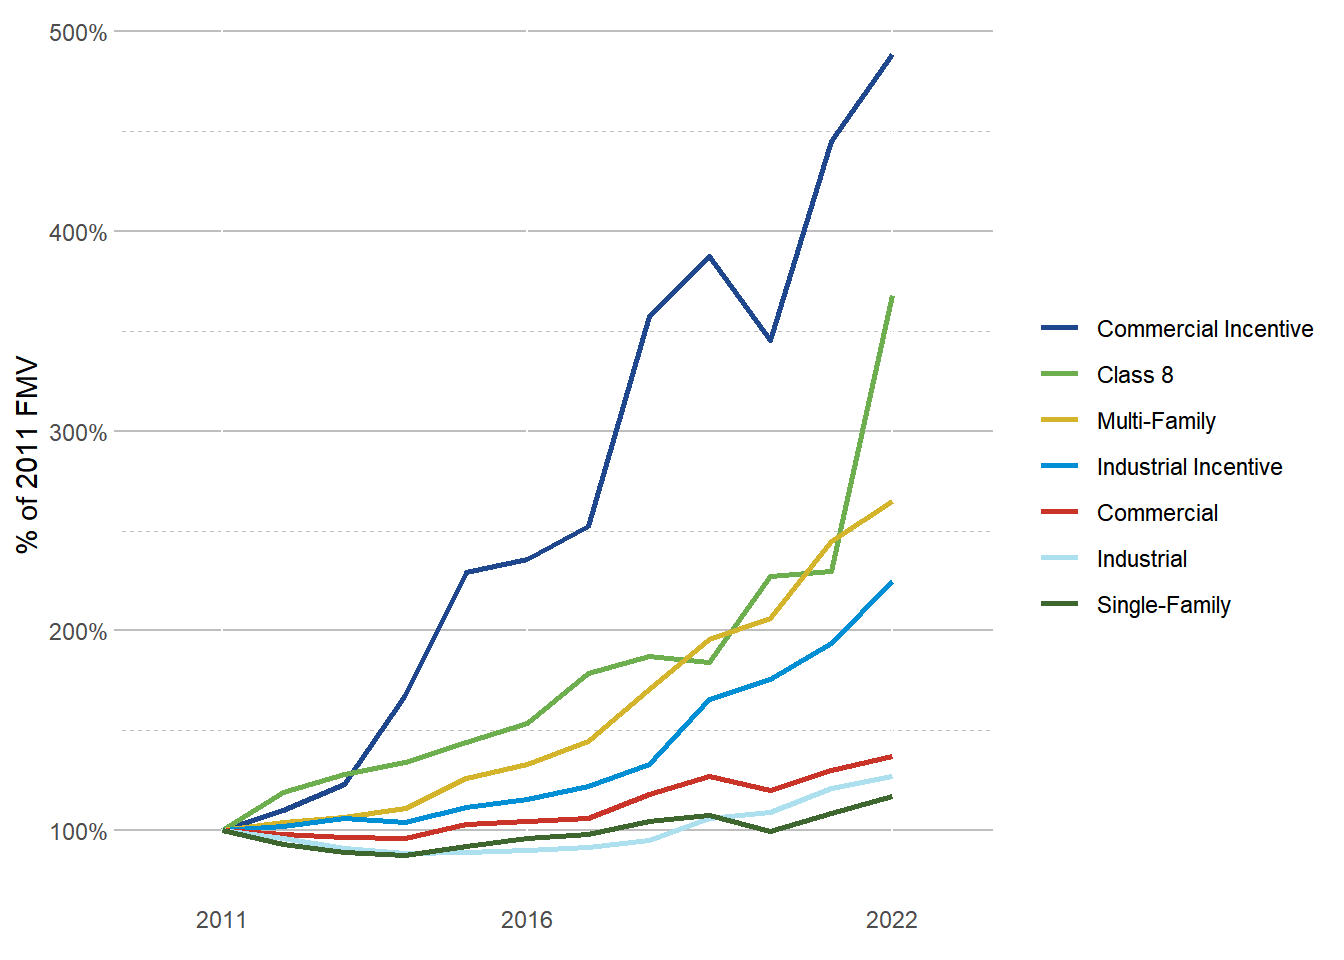
Figure 7.2: Similar to Appendix Figure in Incentive Report Incentive FMV Growth, All Years. Indexed to 2011.
Table 7.5: Development on vacant parcels with and without incentive classes.
Code
# Trends in Incentivized FMV as a percent of the base over time## Data prepmuni_MC <-read_csv("../Output/ptaxsim_muni_class_summaries_2006to2023.csv") %>%select(year, clean_name, class, av = muni_c_av)class_dict <-read_csv("../Necessary_Files/class_dict_expanded.csv") %>%select(class = class_code, class_1dig, assess_ratio, incent_prop, land_use=Alea_cat, major_class_code)muni_MC <- muni_MC %>%left_join(class_dict, by =c("class")) %>%filter(class !=0) # drop exempt property types with 0 taxable value#class_8_munis <- read_csv("./Necessary_Files/datarequests_Class8Munis.csv")class_8_munis <-read_csv("../Output/datarequests_Class8Munis.csv")# changed from as.list to as.characterclass_8_munis <-as.character(class_8_munis$clean_name)# class 8 munis - at the year-class levelclass_8_df <-# left_join(muni_MC, class_dict, by = "class") %>% muni_MC %>%filter(clean_name %in% class_8_munis) %>%filter(av !=0) %>%mutate(FMV = av/assess_ratio) %>%group_by(year) %>%mutate(year_tb_tot =sum(FMV)) %>%# tax base for all class 8 munis together, per yearungroup() %>%filter(land_use %in%c("Industrial", "Commercial")) %>%## drops all non-industrial and non-commercial classes to calculate the rest of the totalsgroup_by(year) %>%mutate(year_ind_comm_FMV =sum(FMV)) %>%# total commercial and industrial FMV for all class 8 munis together, per yearungroup() %>%group_by(year, clean_name) %>%mutate(muni_year_ind_comm_FMV =sum(FMV)) %>%# calculates total FMV in each munis each yearungroup() %>%group_by(year, land_use) %>%mutate(cat_year_FMV =sum(FMV)) %>%# calculates FMV within each commercial vs industrial category for each yearungroup() %>%group_by(year, clean_name, class_1dig) %>%# total fmv in class 5, 6, 7, and 8 per munimutate(year_muni_class_FMV =sum(FMV))## Added this for cook level totals:class_8_df_outofCook <- muni_MC %>%# filter(clean_name %in% class_8_munis) %>% ## keep all munis, use for cook county totals.filter(av !=0) %>%mutate(FMV = av/assess_ratio) %>%group_by(year) %>%mutate(year_tb_tot =sum(FMV)) %>%# tax base for all class 8 munis together, per yearungroup() %>%filter(land_use %in%c("Industrial", "Commercial")) %>%## drops all non-industrial and non-commercial classes to calculate the rest of the totalsgroup_by(year) %>%mutate(year_ind_comm_FMV =sum(FMV)) %>%# total commercial and industrial FMV for all class 8 munis together, per yearungroup() %>%group_by(year, clean_name) %>%mutate(muni_year_ind_comm_FMV =sum(FMV)) %>%# calculates total FMV in each munis each yearungroup() %>%group_by(year, land_use) %>%mutate(cat_year_FMV =sum(FMV)) %>%# calculates FMV within each commercial vs industrial category for each yearungroup() %>%group_by(year, clean_name, class_1dig) %>%# total fmv in class 5, 6, 7, and 8 per munimutate(year_muni_class_FMV =sum(FMV))## Class 8 Townships Graph -------------------## Alea Version: ggplot() +geom_line(data = class_8_df %>%group_by(year) %>%summarize(ind_comm_perc =mean(year_ind_comm_FMV/year_tb_tot)), aes(x = year, y = ind_comm_perc, color ="Commercial+Industrial"), lwd =1) +# industrial fmvgeom_line(data = class_8_df %>%filter(land_use =="Industrial") %>%group_by(year) %>%# needed na.rm=TRUE, otherwise it didn't work. perc_industrial was not being calculated without it.summarize(perc_industrial =sum(FMV/year_tb_tot, na.rm=TRUE)), ## added this partaes(x = year, y = perc_industrial, color ="Industrial"), lwd =1) +# commercial fmvgeom_line(data = class_8_df %>%filter(land_use =="Commercial") %>%group_by(year) %>%summarize(perc_commercial =sum(FMV/year_tb_tot, na.rm=TRUE)), ## added this partaes(x = year, y = perc_commercial, color ="Commercial"), lwd =1) +geom_line(data = class_8_df %>%filter(incent_prop =="Incentive") %>%group_by(year) %>%summarise(incent_perc =sum(FMV)/year_tb_tot),aes(x = year, y = incent_perc, color ="Incentive Classes"), lwd =1 ) +geom_line(data = class_8_df %>%# threw error here, missing x and y in aes()filter(class_1dig ==8) %>%group_by(year) %>%summarize(perc_8 =sum(FMV/year_tb_tot)), ## added this partaes(x = year, y = perc_8, color ="Class 8"), lwd =1) +# was missing a + sign heretheme_classic() +scale_x_continuous(name ="", breaks =seq(2006, 2022, by =3), limits =c(2006, 2022), expand =c(0,0)) +scale_y_continuous(name ="Percent of FMV", labels = scales::percent_format(), limits =c(0, 0.20),breaks =seq(0, 0.5, by =0.05), expand =c(0,0)) +scale_color_manual(name ="", values =c("Commercial+Industrial"="black", "Industrial"="gray70", "Commercial"="gray50", "Incentive Classes"="orange", "Class 8"="red" )) +theme(legend.position ="bottom") +labs(title ="Property in the Class 8 Townships") +guides(color =guide_legend(nrow=2, byrow =TRUE))## Percentage out of Cook County ---------------------## Alea Version for Cook Level: ggplot() +# Commercial + Industrial FMV in cookgeom_line(data = class_8_df_outofCook %>%group_by(year) %>%#didn't group by year before?summarize(ind_comm_perc =mean(year_ind_comm_FMV/year_tb_tot)), aes(x = year, y = ind_comm_perc, color ="Commercial+Industrial"), lwd =1) +# incentive class properties in cookgeom_line(data = class_8_df_outofCook %>%filter(incent_prop =="Incentive") %>%group_by(year) %>%summarise(incent_perc =sum(FMV/year_tb_tot)),aes(x = year, y = incent_perc, color ="Incentive Classes"), lwd =1 ) +# FMV with class 8 property class in cook countygeom_line(data = class_8_df_outofCook %>%# threw error here, missing x and y in aes()filter(class_1dig ==8) %>%group_by(year) %>%summarize(perc_8 =sum(FMV/year_tb_tot)), ## added this partaes(x = year, y = perc_8, color ="Class 8"), lwd =1) +# was missing a + sign here# industrial fmv in cook countygeom_line(data = class_8_df_outofCook %>%# threw error here, missing x and y in aes()filter(land_use =="Industrial") %>%group_by(year) %>%# needed na.rm=TRUE, otherwise it didn't work. perc_industrial was not being calculated without it.summarize(perc_industrial =sum(FMV/year_tb_tot, na.rm=TRUE)), ## added this partaes(x = year, y = perc_industrial, color ="Industrial"), lwd =1) +# commercial fmv in cook countygeom_line(data = class_8_df_outofCook %>%# threw error here, missing x and y in aes()filter(land_use =="Commercial") %>%group_by(year) %>%summarize(perc_commercial =sum(FMV/year_tb_tot, na.rm=TRUE)), ## added this partaes(x = year, y = perc_commercial, color ="Commercial"), lwd =1) +# make it pretty:theme_classic() +scale_x_continuous(name ="", breaks =seq(2006, 2022, by =3), limits =c(2006, 2022), expand =c(0,0)) +scale_y_continuous(name ="Percent of County FMV", labels = scales::percent_format(), limits =c(0, 0.20), breaks =seq(0, 0.5, by =0.05), expand =c(0,0)) +scale_color_manual(name ="", values =c("Commercial+Industrial"="black", "Industrial"="gray80", "Commercial"="gray40", "Incentive Classes"="orange", "Class 8"="red")) +theme(legend.position ="bottom") +labs(title="Cook County Commercial & Industrial FMV") +guides(color =guide_legend(nrow=2, byrow =TRUE))## Newest Addition for April 30th Presentation --------------------ggplot() +# incentive class properties in cookgeom_line(data = class_8_df_outofCook %>%filter(incent_prop =="Incentive") %>%group_by(year) %>%summarise(incent_perc =sum(FMV/year_ind_comm_FMV)),aes(x = year, y = incent_perc, color ="Incentive Classes"), lwd =1 ) +# FMV with class 8 property class in cook countygeom_line(data = class_8_df_outofCook %>%filter(class_1dig ==8) %>%group_by(year) %>%summarize(perc_8 =sum(FMV/year_ind_comm_FMV)), aes(x = year, y = perc_8, color ="Class 8"), lwd =1) +# make it pretty:theme_classic() +scale_x_continuous(name ="", breaks =seq(2006, 2022, by =3), limits =c(2006, 2022), expand =c(0,0)) +scale_y_continuous(name ="Percent of Com+Ind FMV", labels = scales::percent_format(), limits =c(0, 0.25), breaks =seq(0, 0.5, by =0.05), expand =c(0,0)) +scale_color_manual(name ="", values =c("Industrial"="gray80", "Commercial"="gray40", "Incentive Classes"="orange", "Class 8"="red")) +theme(legend.position ="bottom") +labs(title="Cook County", subtitle ="Share of Commercial & Industrial FMV with Incentive Classification") +guides(color =guide_legend(nrow=2, byrow =TRUE))## Newest Addition for April 30th Presentation --------------------ggplot() +# incentive class properties in cookgeom_line(data = class_8_df_outofCook %>%filter(incent_prop =="Incentive") %>%group_by(year) %>%summarise(incent_perc =sum(FMV/year_ind_comm_FMV)),aes(x = year, y = incent_perc, color ="Incentive Classes"), lwd =1 ) +# # # FMV with class 8 property class in cook county# geom_line(data = class_8_df_outofCook %>% # filter(class_1dig == 8) %>% # group_by(year) %>%# summarize(perc_8 = sum(FMV/year_ind_comm_FMV)), # aes(x = year, y = perc_8, color = "Class 8"), lwd = 1) + # make it pretty:theme_classic() +scale_x_continuous(name ="", breaks =seq(2006, 2022, by =3), limits =c(2006, 2022), expand =c(0,0)) +scale_y_continuous(name ="Percent of Com+Ind FMV", labels = scales::percent_format(), limits =c(0, 0.25), breaks =seq(0, 0.5, by =0.05), expand =c(0,0)) +scale_color_manual(name ="", values =c("Industrial"="gray80", "Commercial"="gray40", "Incentive Classes"="orange")) +theme(legend.position ="bottom") +labs(title="Cook County", subtitle ="Share of Commercial & Industrial FMV with Incentive Classification") +guides(color =guide_legend(nrow=2, byrow =TRUE))ggplot() +geom_line(data = class_8_df %>%filter(incent_prop =="Incentive") %>%group_by(year) %>%summarise(incent_perc =sum(FMV/year_ind_comm_FMV)),aes(x = year, y = incent_perc, color ="All Incentive Classes"), lwd =1 ) +geom_line(data = class_8_df %>%filter(class_1dig ==8) %>%group_by(year) %>%summarize(perc_8 =sum(FMV/year_ind_comm_FMV)), aes(x = year, y = perc_8, color ="Class 8"), lwd =1) +# make it pretty:theme_classic() +scale_x_continuous(name ="", breaks =seq(2006, 2022, by =3), limits =c(2006, 2022), expand =c(0,0)) +scale_y_continuous(name ="Percent of Com&Ind FMV", labels = scales::percent_format(), # limits = c(0, 0.25), breaks =seq(0, 0.5, by =0.05), expand =c(0,0)) +scale_color_manual(name ="", values =c("Commercial+Industrial"="black", "Industrial"="gray80", "Commercial"="gray40", "All Incentive Classes"="orange", "Class 8"="red")) +theme(legend.position ="bottom") +labs(title="Class 8 Townships", subtitle ="Share of Commercial & Industrial FMV with Incentive Classification") +guides(color =guide_legend(nrow=2, byrow =TRUE))
Table 7.6: Aggregate FMV Growth by Incentive Classification. Changes Sometime includes properties that gained or lost an incentive classification. incent_status in tables below breaks up Changes Sometime into more detailed categories.
Table 7.7: Aggregate FMV Growth by incent_status. Calculations for PINs counts in header of table in report. Always Had Incentive and Never Had Incentive should be identical to table above.
Table 7.9: Growth from 2006 to 2023 - Change in Land Use by Incentive Class Status. Non-winsorized version of table.
Code
df_2011_bal %>%mutate(year =as.numeric(year)) |>ggplot() +geom_line(aes(x=year, fmv_group_growth, group = incent_status, color = incent_status), lwd =1) +theme_bw() +scale_y_continuous(labels = scales::percent)+scale_color_manual(values = cmap_colors) +scale_x_continuous(limits =c(2005, 2024), breaks =c(2006, 2015, 2023)) +theme( panel.background = ggplot2::element_blank(),panel.grid.minor.x = ggplot2::element_blank(),panel.grid.major.x = ggplot2::element_blank(),panel.grid.major.y =element_line(color ="grey"),panel.grid.minor.y =element_line(color ="grey", linetype ="dashed"),axis.ticks =element_line(color ="gray"),axis.ticks.x =element_blank(),legend.position ="bottom") +labs(title ="FMV Growth for Properties with Incentives, Indexed to 2006", color =element_blank(),x =element_blank(), y ="FMV Growth since 2006",caption ="Broken into subcategories to keep sample size the same over time.") +facet_wrap(~landuse_change)
Figure 7.4: Includes the ‘Excluded’ Category. For comparison only to show what was excluded in next image.
Code
df_2011_bal %>%mutate(year =as.numeric(year)) |>filter(incent_status !="Excluded"& landuse_change !="Excluded"& landuse_change !="Exempt Sometime") %>%ggplot() +geom_line(aes(x=year, fmv_group_growth, group = incent_status, color = incent_status), lwd=1) +# labs( title = "FMV Growth Since 2011 by Land Use", # caption = "PINs that did not exist during all years of the sample frame were excluded from the image (n=10,809)."# ) + theme_bw() +scale_y_continuous(labels = scales::percent)+scale_color_manual(values = cmap_colors) +theme( panel.background = ggplot2::element_blank(),panel.grid.minor.x = ggplot2::element_blank(),panel.grid.major.x = ggplot2::element_blank(),panel.grid.major.y =element_line(color ="grey"),panel.grid.minor.y =element_line(color ="grey", linetype ="dashed"),axis.ticks =element_line(color ="gray"),axis.ticks.x =element_blank(),legend.position ="bottom") +facet_wrap(~landuse_change) +scale_x_continuous(limits =c(2005, 2024), breaks =c(2006, 2015, 2023)) +labs(title ="FMV Growth for Properties with Incentives, Indexed to 2006", color =element_blank(),x =element_blank(), y ="FMV Growth since 2006",caption ="Broken into subcategories to keep sample size the same over time.")
Figure 7.5: Excludes the ‘Excluded’ Category and ‘Exempt Sometime’ properties.
Code
df_2011_bal %>%mutate(year =as.factor(year)) %>%ggplot() +geom_line(aes(x=year, y=fmv_group_growth, group = landuse_change, color = landuse_change), lwd =1) +theme_bw() +facet_wrap(~incent_status, nrow =1) +scale_x_discrete(#limits = c(2005, 2024), breaks =c(2006, params$year)) +scale_y_continuous(labels = scales::percent) +scale_color_manual(values = cmap_colors) +labs(title=paste0("Growth from 2006 to ", params$year),subtitle ="Incentive Classification Status by Land Use Change",y ="FMV Growth", x =NULL,caption ="Values are indexed to 2006 FMV") +theme( panel.background = ggplot2::element_blank(),panel.grid.minor.x = ggplot2::element_blank(),panel.grid.major.x = ggplot2::element_blank(),panel.grid.major.y =element_line(color ="grey"),panel.grid.minor.y =element_line(color ="grey", linetype ="dashed"),axis.ticks =element_line(color ="gray"),axis.ticks.x =element_blank(),legend.position ="bottom",legend.title =element_blank())
Figure 7.6: Growth from 2006 to 2023. Faceted by if a PIN changed landuse during the sample period. Indexed to fair market value during 2011. Only for comparison to show what has been dropped in the next image.
Code
df_2011_bal %>%filter(landuse_change !="Excluded"& incent_status !="Excluded"& landuse_change !="Exempt Sometime") %>%mutate(year =as.numeric(year)) %>%select(year, fmv_group_growth, landuse_change) |>ggplot() +geom_line(aes(x=year, y=fmv_group_growth, group = landuse_change, color = landuse_change), lwd =1) +theme_bw() +facet_wrap(~incent_status, nrow =1) +scale_x_continuous(limits =c(min_year-1, max_year+1),breaks =c(min_year, 2015, max_year)) +scale_y_continuous(labels = scales::percent) +scale_color_manual(values = cmap_colors) +labs(title="Growth from 2006", subtitle ="Incentive Classification Status by Land Use Change",y ="FMV Growth since 2006", x =NULL,caption =paste0("Values are indexed to 2006 FMV. Excludes PINs that were tax exempt some years or did not exist for all years between 2006 and ", params$year)) +theme( panel.background = ggplot2::element_blank(),panel.grid.minor.x = ggplot2::element_blank(),panel.grid.major.x = ggplot2::element_blank(),panel.grid.major.y =element_line(color ="grey"),panel.grid.minor.y =element_line(color ="grey", linetype ="dashed"),axis.ticks =element_line(color ="gray"),axis.ticks.x =element_blank(),legend.position ="bottom",legend.title =element_blank())
Figure 7.7: Aggregate FMV Growth from 2006 to 2023. Faceted by PIN incentive status during the sample period. Indexed to fair market value during 2006.
Explore PINs that became Class 8 or Other Incentive in South Triad
Table 7.10: South Triad Number of PINs that became each major class type each year.
Trends for Incentive Report - FMV Growth 2011-2022
The file comm_ind_PINs_2011to2022_timeseries.csv contains all PINs that had an incentive property class for at least 1 year. It includes all observations for a property during the years that it existed, even if it is not an incentive class property in that year.
Only includes PINs in incorporated areas.
Code
# Create an empty data frame with a column named "year"params <-data.frame(year =numeric(0))# Add the value 2021 to the "year" columnparams <-rbind(params, data.frame(year =2022))year_count <-12comm_ind_pins <-read_csv("../Output/comm_ind_PINs_2011to2022_timeseries.csv")min_year =2011max_year =2022
Table 7.15: Aggregate FMV Growth by Incentive Classification. Changes Sometime includes properties that gained or lost an incentive classification. incent_status in tables below breaks up Changes Sometime into more detailed categories.
Table 7.18: Growth from 2011 to 2022 - Change in Land Use by Incentive Class Status. Non-winsorized version of table.
Code
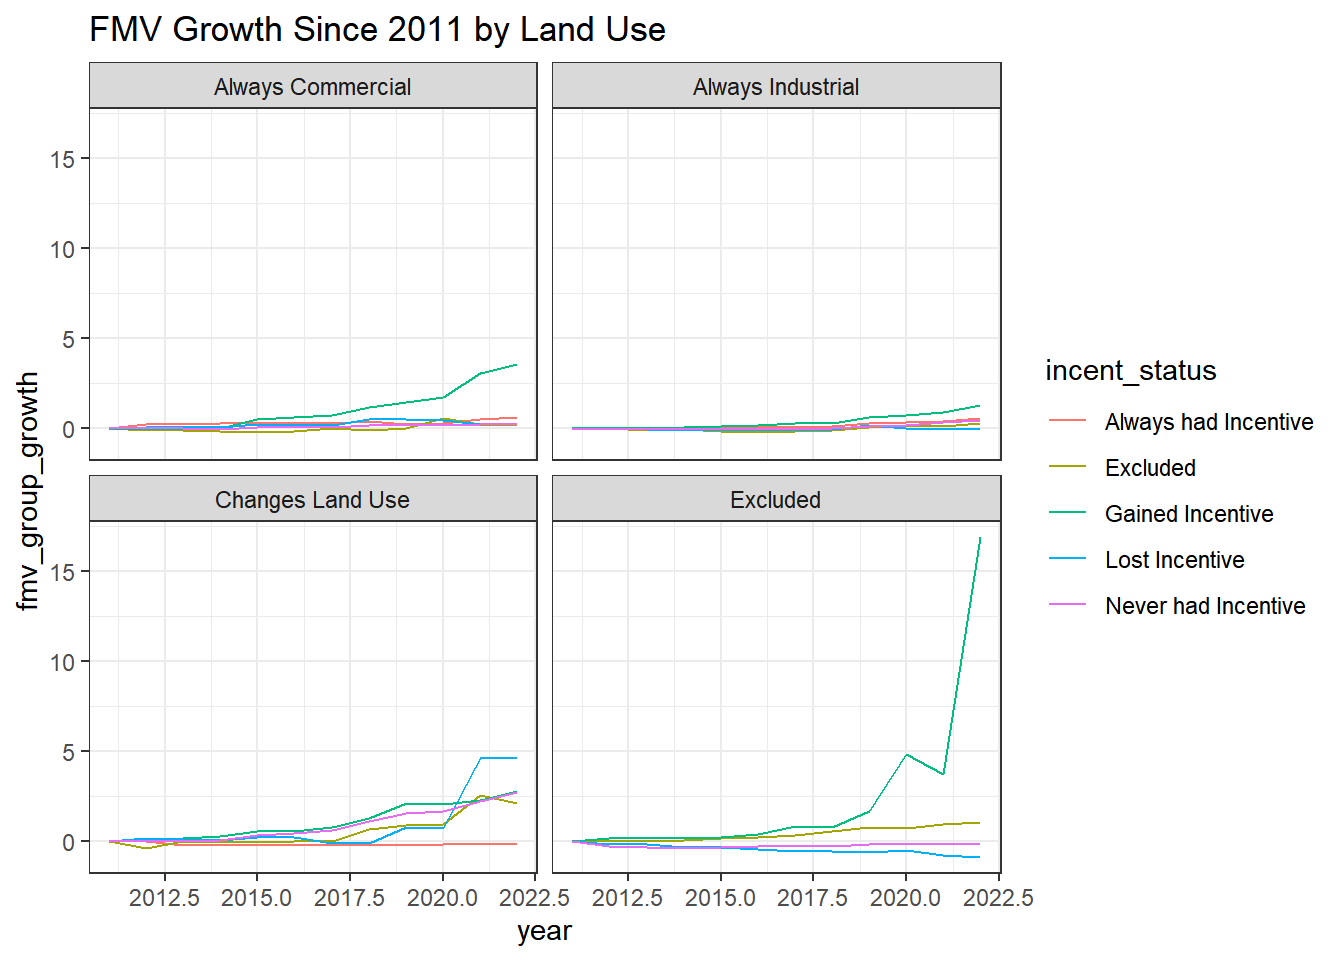
df_2011_bal %>%ggplot() +geom_line(aes(x=year, fmv_group_growth, group = incent_status, color = incent_status), lwd=1) +labs( title ="FMV Growth Since 2011 by Land Use & Incentive Status", x =element_blank(),y ="FMV Growth since 2011", color =element_blank()) +theme_bw() +scale_color_manual(values = cmap_colors) +theme( panel.background = ggplot2::element_blank(),panel.grid.minor.x = ggplot2::element_blank(),panel.grid.major.x = ggplot2::element_blank(),panel.grid.major.y =element_line(color ="grey"),panel.grid.minor.y =element_line(color ="grey", linetype ="dashed"),axis.ticks =element_line(color ="gray"),axis.ticks.x =element_blank(),legend.position ="bottom") +facet_wrap(~landuse_change)+scale_x_continuous(limits =c(2010, 2024), breaks =c(2011, 2017, 2023))
Figure 7.12: Includes the ‘Excluded’ Category
Code
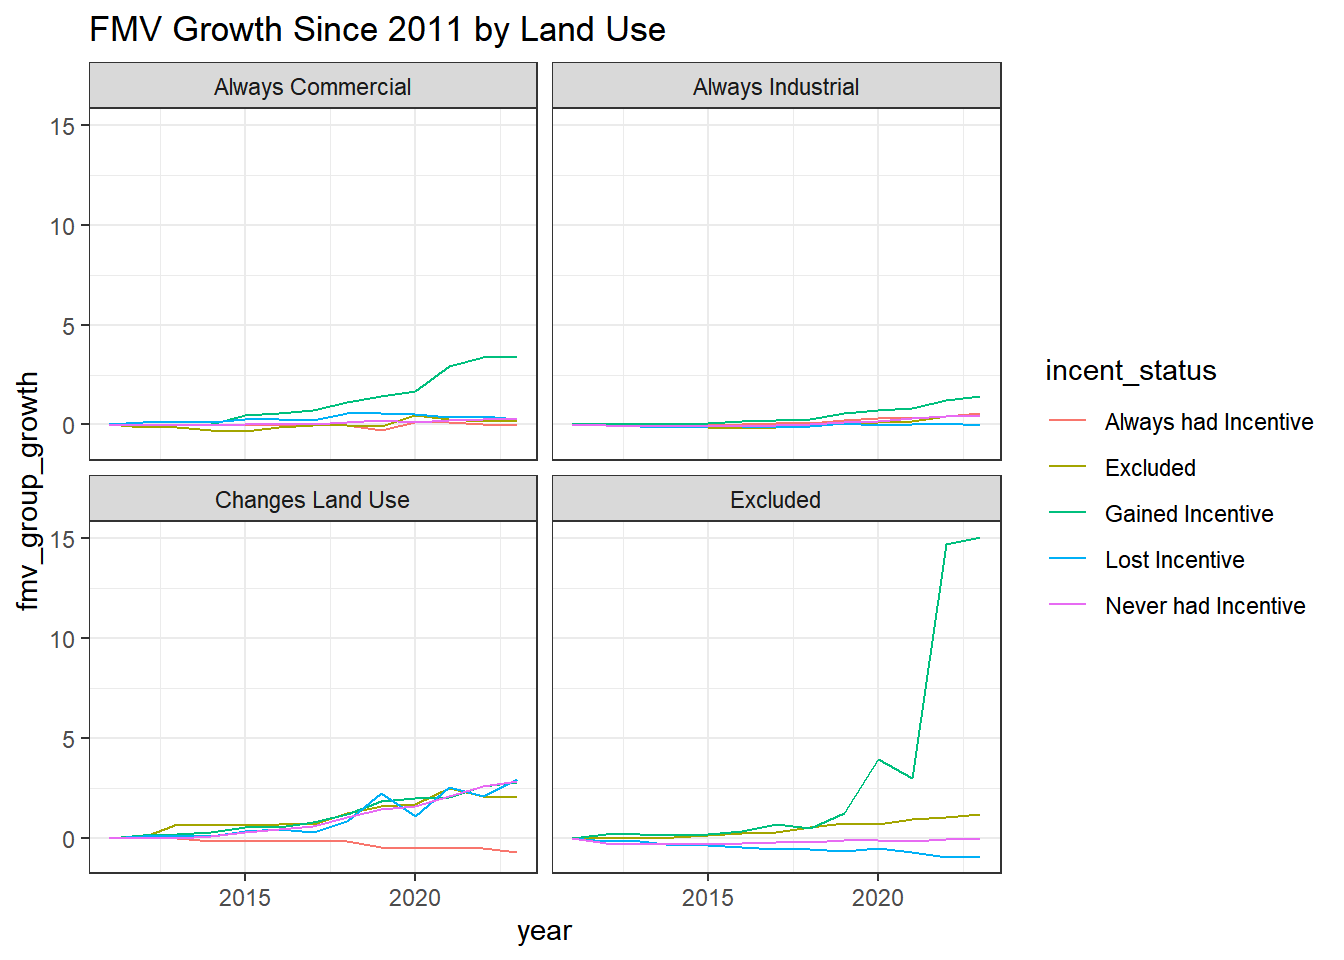
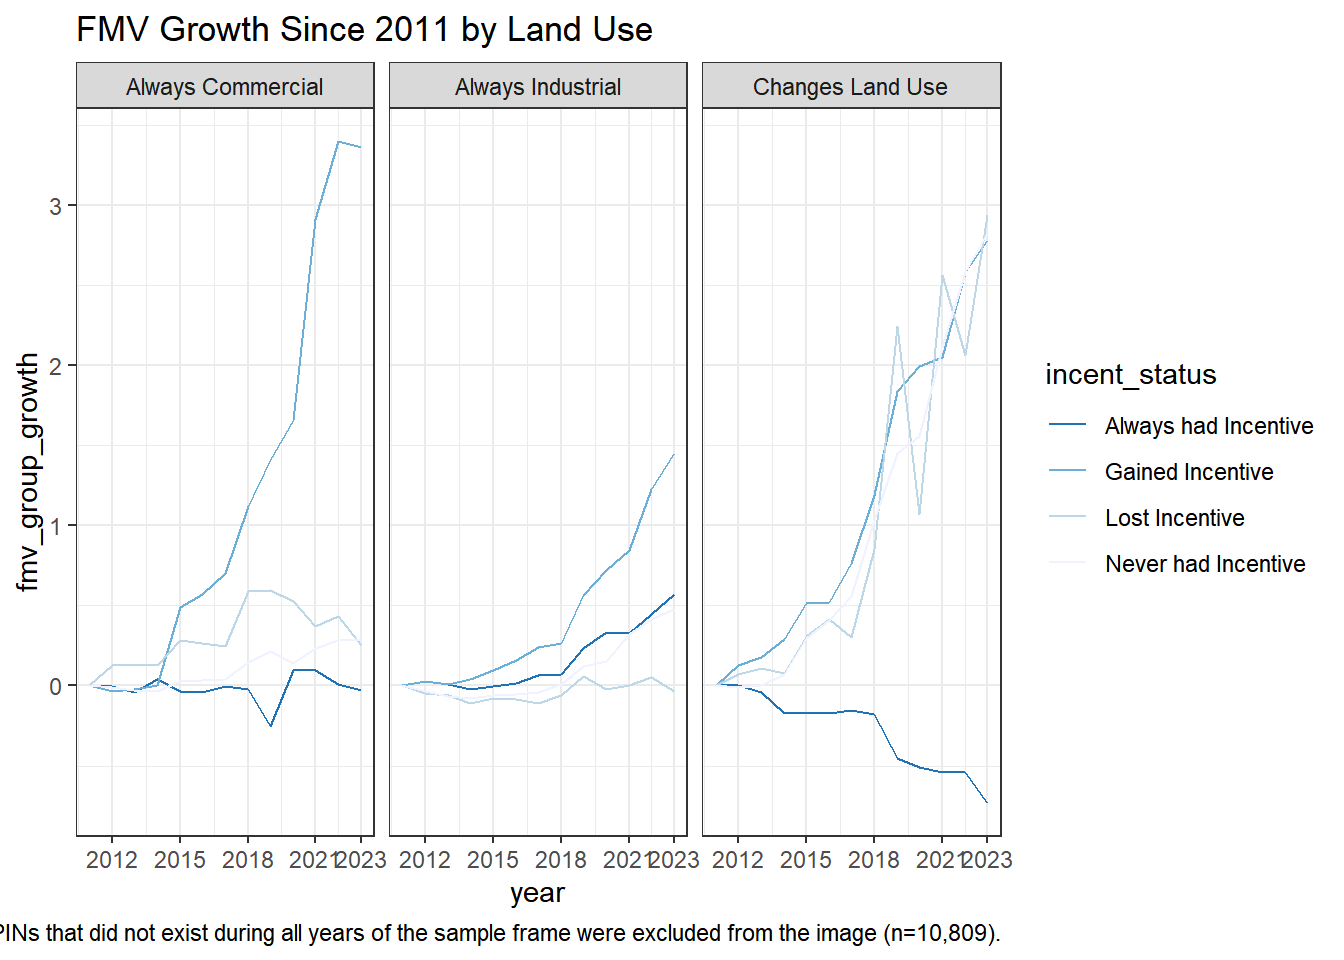
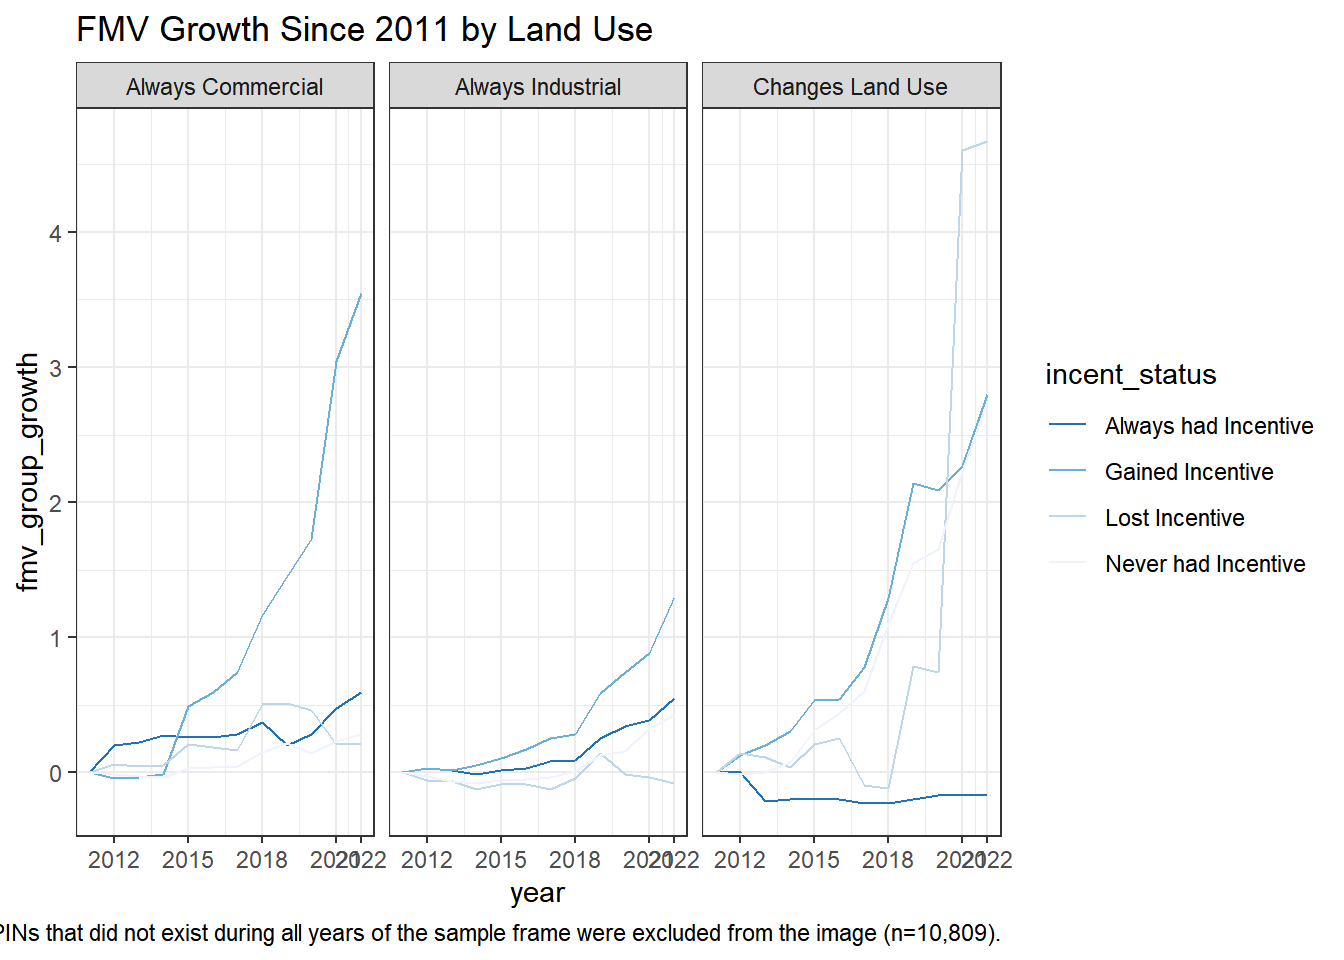
df_2011_bal %>%filter(incent_status !="Excluded"& landuse_change !="Excluded"& landuse_change !="Exempt Sometime") %>%ggplot() +geom_line(aes(x=year, fmv_group_growth, group = incent_status, color = incent_status),lwd=1) +labs( title ="FMV Growth Since 2011 by Land Use", caption ="PINs that did not exist during all years of the sample frame were excluded from the image (n=10,809).",x =element_blank(),y ="FMV Growth since 2011" ) +scale_color_manual(values = cmap_colors) +theme_bw() +scale_y_continuous(labels = scales::percent) +scale_x_continuous(limits =c(min_year -1, max_year +1), breaks =c(min_year, max_year)) +theme( panel.background = ggplot2::element_blank(),panel.grid.minor.x = ggplot2::element_blank(),panel.grid.major.x = ggplot2::element_blank(),panel.grid.major.y =element_line(color ="grey"),panel.grid.minor.y =element_line(color ="grey", linetype ="dashed"),axis.ticks =element_line(color ="gray"),axis.ticks.x =element_blank(),legend.position ="bottom", legend.title =element_blank()) +facet_wrap(~landuse_change)
Figure 7.13: Excludes the ‘Excluded’ Category and ‘Exempt Sometime’ properties.
Code
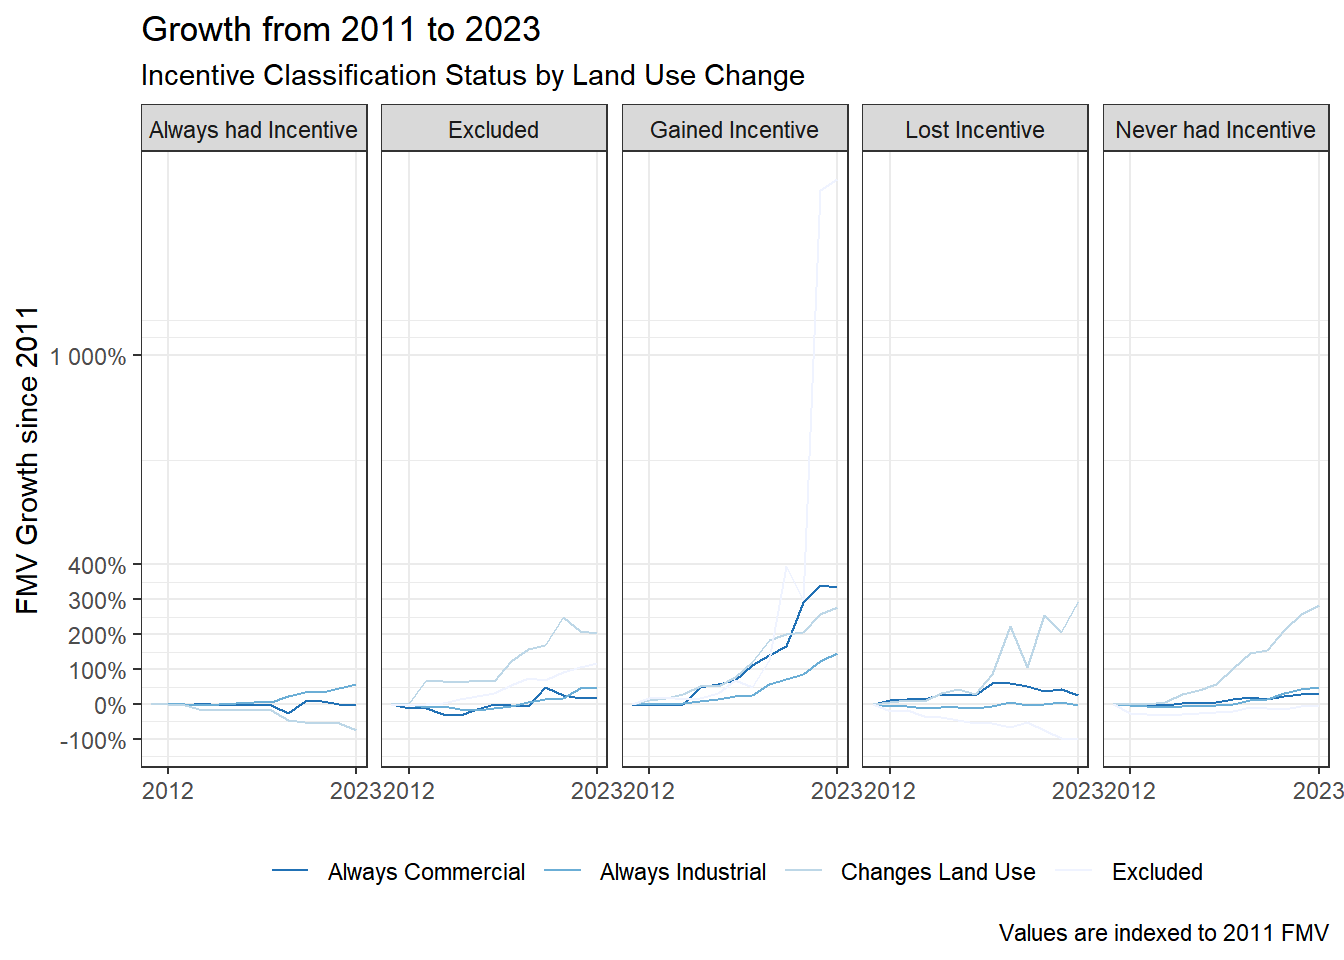
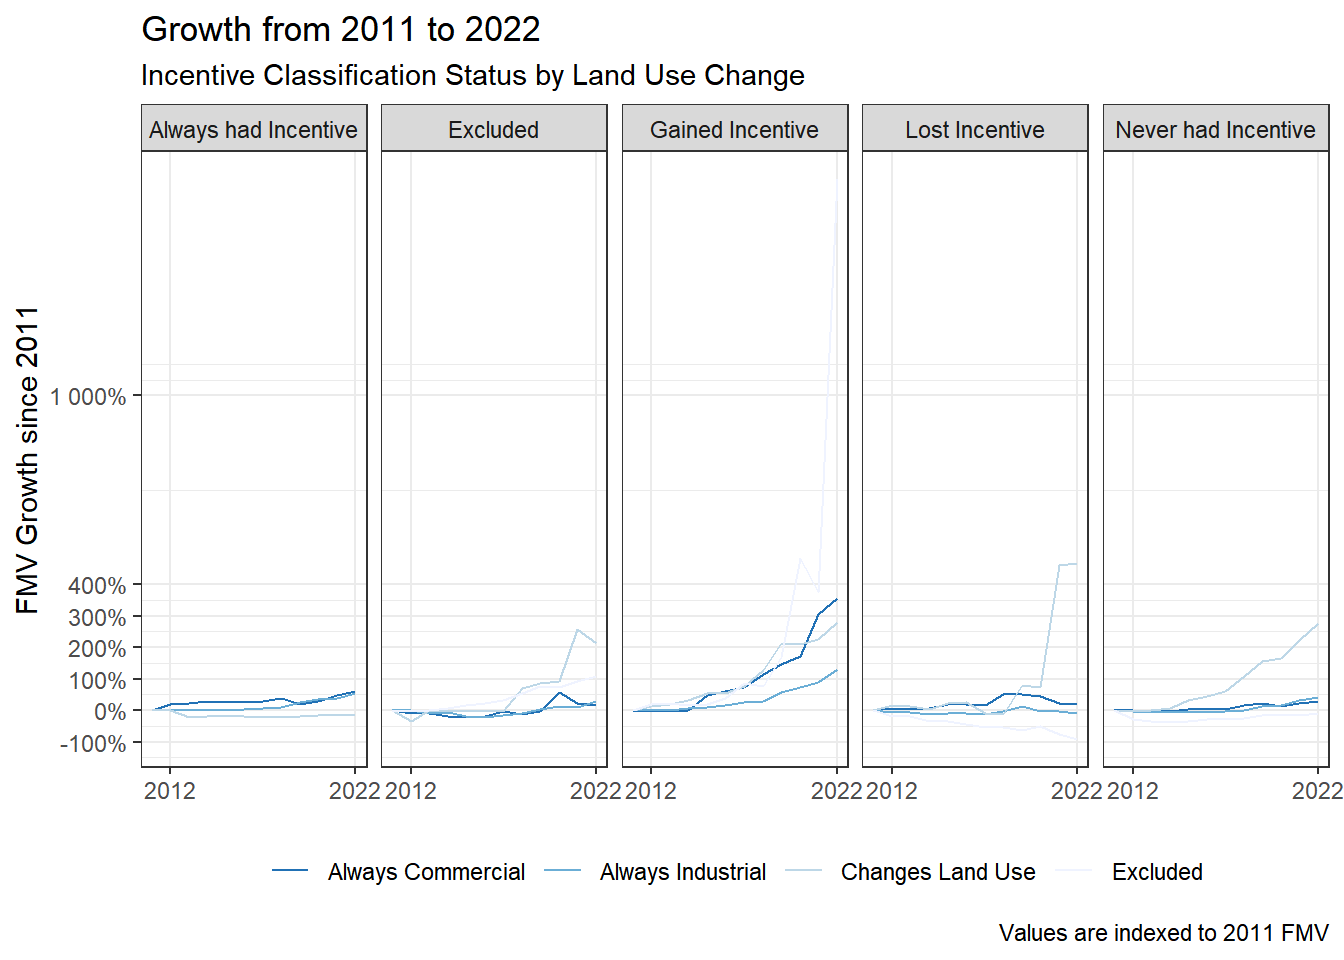
Table9_data <- df_2011_bal %>%mutate(year =as.factor(year)) |>select(year, fmv_group_growth, landuse_change) Table9_data %>%ggplot() +geom_line(aes(x=year, y=fmv_group_growth, group = landuse_change, color = landuse_change), lwd=1) +theme_bw() +facet_wrap(~incent_status, nrow =1) +scale_x_discrete(breaks =c(2012, params$year)) +scale_y_continuous(labels = scales::percent) +scale_color_manual(values = cmap_colors) +labs(title=paste0("Growth from 2011 to ", params$year),subtitle ="Incentive Classification Status by Land Use Change",y ="FMV Growth since 2011", x =NULL,caption ="Values are indexed to 2011 FMV") +theme( panel.background = ggplot2::element_blank(),panel.grid.minor.x = ggplot2::element_blank(),panel.grid.major.x = ggplot2::element_blank(),panel.grid.major.y =element_line(color ="grey"),panel.grid.minor.y =element_line(color ="grey", linetype ="dashed"),axis.ticks =element_line(color ="gray"),axis.ticks.x =element_blank(),legend.position ="bottom",legend.title =element_blank())
Figure 7.14: Growth from 2011 to 2022. Faceted by if a PIN changed landuse during the sample period. Indexed to fair market value during 2011. For comparison only.
Code
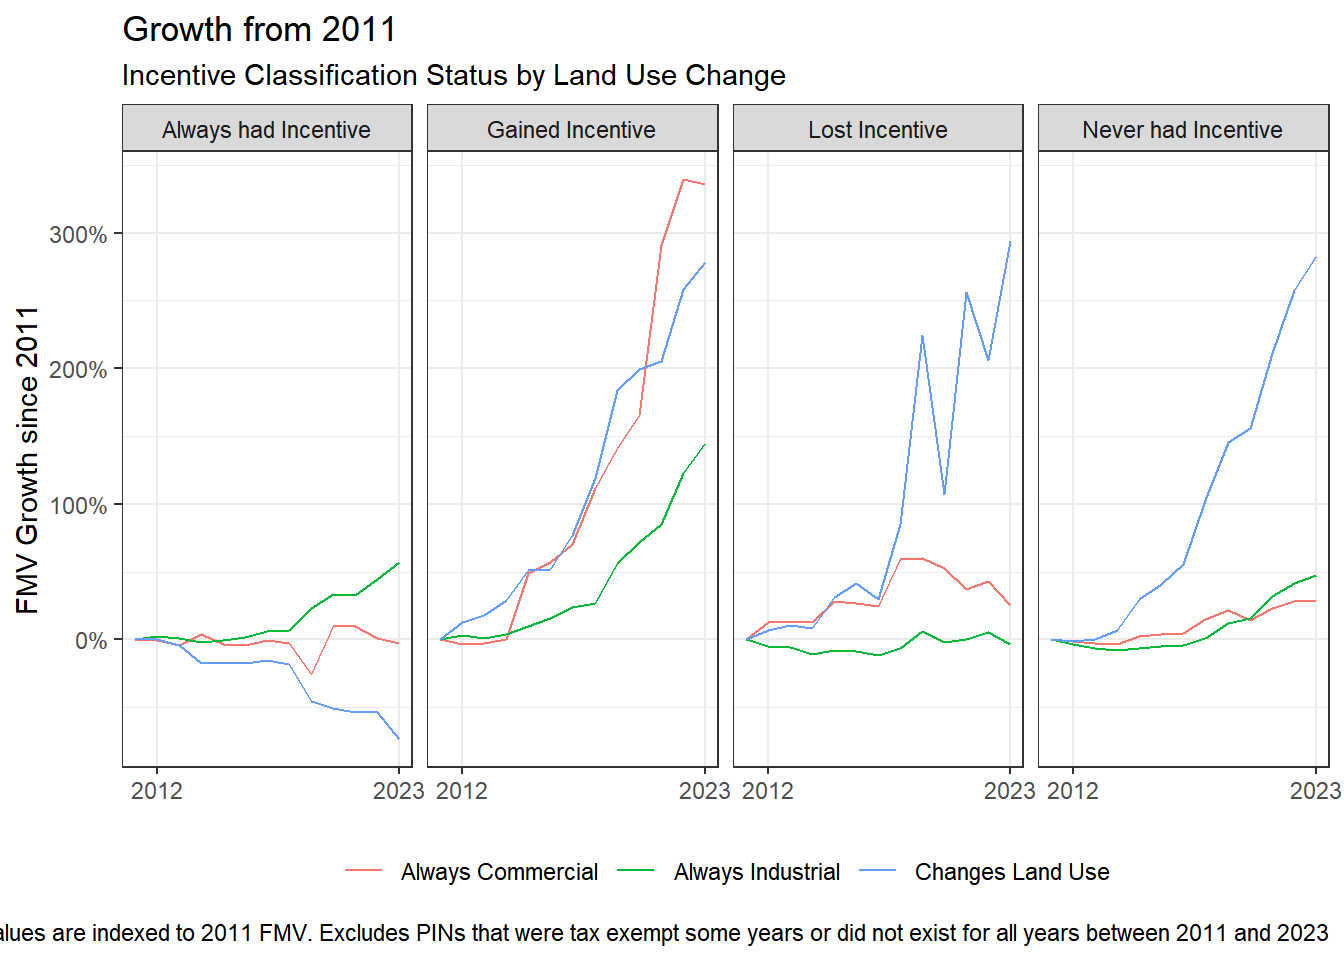
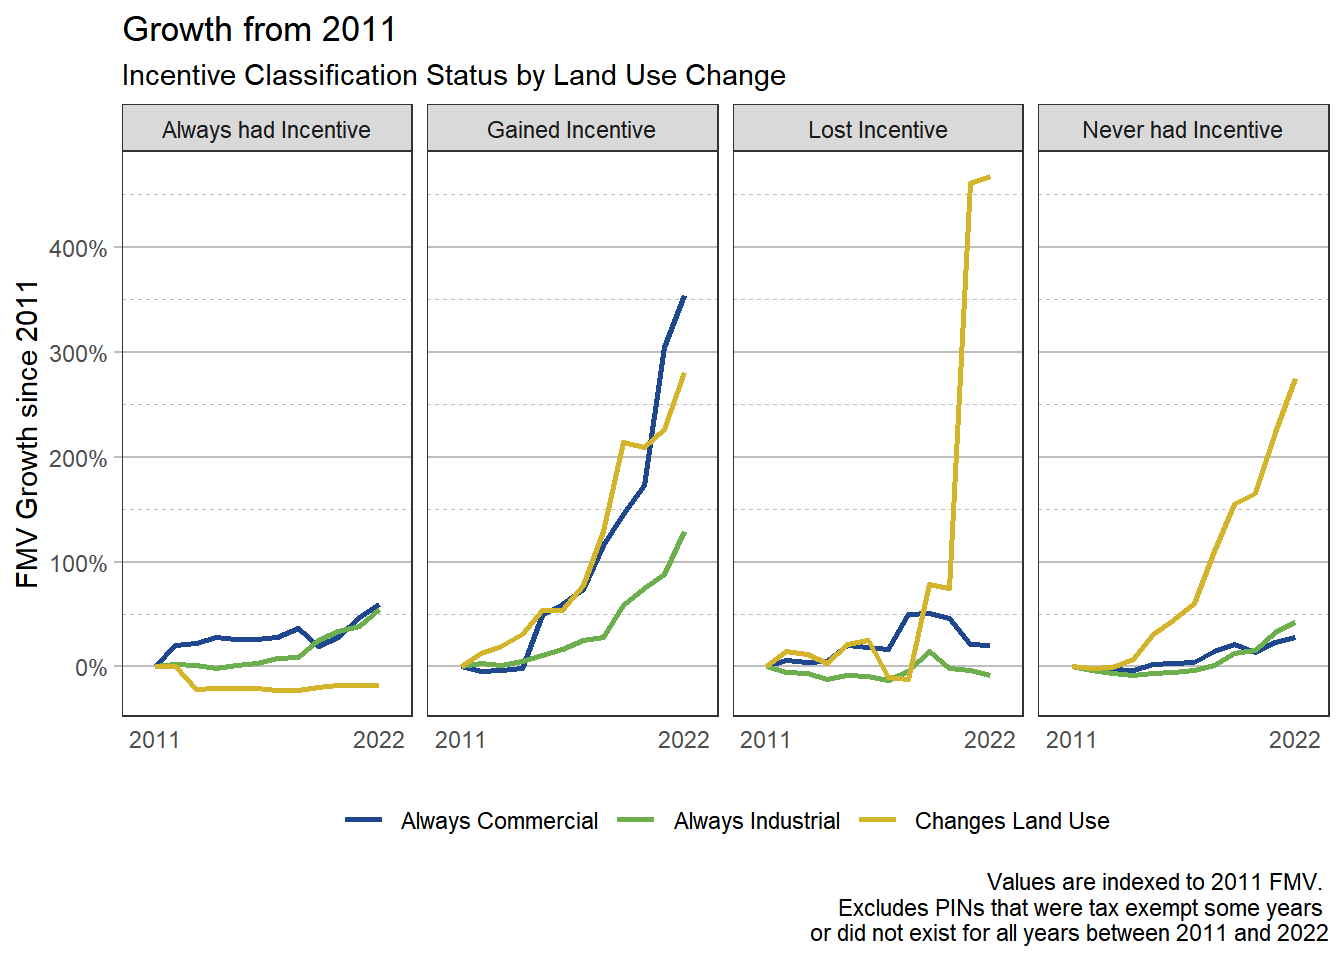
Figure10_data <- df_2011_bal %>%filter(landuse_change !="Excluded"& incent_status !="Excluded"& landuse_change !="Exempt Sometime") %>%mutate(year =as.numeric(year)) %>%select(year, incent_status, landuse_change, fmv_group_growth)Figure10_data |>ggplot() +geom_line(aes(x=year, y=fmv_group_growth, group = landuse_change, color =fct_reorder2(landuse_change, year, fmv_group_growth)), lwd=1) +theme_bw() +facet_wrap(~incent_status, nrow =1) +scale_x_continuous(limits =c(min_year-1, max_year+1), breaks =c(min_year, max_year)) +labs(title="Growth from 2011", subtitle ="Incentive Classification Status by Land Use Change",y ="FMV Growth since 2011", x =NULL,caption =paste0("Values are indexed to 2011 FMV. \nExcludes PINs that were tax exempt some years \nor did not exist for all years between 2011 and ", params$year)) +theme( panel.background = ggplot2::element_blank(),panel.grid.minor.x = ggplot2::element_blank(),panel.grid.major.x = ggplot2::element_blank(),panel.grid.major.y =element_line(color ="grey"),panel.grid.minor.y =element_line(color ="grey", linetype ="dashed"),axis.ticks =element_line(color ="gray"),axis.ticks.x =element_blank(),legend.position ="bottom", legend.title =element_blank()) +scale_color_manual(values = cmap_colors) +scale_y_continuous(labels = scales::percent)
Figure 7.15: Figure 10 in Incentive Report Aggregate FMV Growth from 2011 to 2022. Faceted by PIN incentive status during the sample period. Indexed to fair market value during 2011.
library(readxl)tablelist <-list(# table 1 - from cmap"Table 2"= Table2_allyears,# Table 3 from individual year quarto files# Table 4 from individual year quarto files# Table 5 from individual year quarto files# Table 6 from individual year quarto files# Table 7 from individual year quarto files# Table 8 from individual year quarto files"Table 9"= Table9_data, # goes with Figure 10. FMV growth indexed by incent status and land use"Table 10"= Table_newconstruction, "AppIV Table 1"= Appendix_PinCount_allyears,"AppIV Table 2"= Appendix_Table_Class8PINs, # Was table 6 in old versions of document."Figure 1 Data"= Figure1_allyears,"Figure 1 2011-2022"= Figure1_data, # only 2022 to 2022 "Figure 2 Data"= Figure2_data, # Line Chart - FMV for single and multi family vs C&I FMV"Figure 3 Data"= Figure3_data, # Line Chart - Increase in FMV indexed to 2011 for Select property types# Figure 4 from individual year quarto files# Figure 5A and 5B from individual year quarto files# Figure 6-8 by cmap# "Figure 9 Data" = Figure9_data, # dot plots from individual year quarto files"Figure 10 Data"= Figure10_data, # FMV growth indexed by incent status and land use"Appendix Figure X"= Appendix_Figure2_PinCount,"Appendix Figure X+1"= Appendix_PinCount_growth_allyears,"Appendix Figure X+2"= Appendix_Figure_FMVgrowth_allyears# "Muni Stats" = munilevel,# "Muni Rate Change" = muni_ratechange,# # "Cook Sums" = table_cook,# "Cook Major Class Sums" = cty_MC_table,# "Cook Rate Change" = cook_ratechange)writexl::write_xlsx(tablelist, "../Output/calculations_report_content_2025_03_27.xlsx")# readme <- c(# "Pin Change: Count of PINs gaining or losing an incentive class each year.",# "Major Class Change: Counts of PINs becoming major class types each year.",# # "IndustShare_all is same as Indust_share but includes all munis.",# "CommercShare_all is same as Commerc_share but includes all munis.") %>% as.data.frame()# # paper_tables <- list(# "README"= readme,# # "Pin Change per Year" = pins_per_year,# # # )# writexl::write_xlsx(paper_tables, "../Output/incentive_report_tables.xlsx")beepr::beep(sound ="mario")
Source Code
---title: "Yearly Trends - Incentive Classifications"format: html: code-fold: true toc: true toc-location: left tbl-cap-location: margin fig-cap-location: margin df-print: paged---```{r setup}#| output: falseknitr::opts_chunk$set(warning = FALSE, message = FALSE)options(scipen = 999)library(tidyverse)library(glue)library(sf)library(DT)library(flextable)nicknames <- readxl::read_excel("../Necessary_Files/muni_shortnames.xlsx")cook_sums <- read_csv("../Output/ptaxsim_cook_level_2006to2023_new.csv") muni_shp <- read_sf("../Necessary_Files/muni_shp.gpkg")knitr::opts_chunk$set(warning = FALSE, message = FALSE)set_flextable_defaults(theme_fun = theme_vanilla, padding = 2, line_spacing = 1, big.mark = ",", )options(DT.options = list())FitFlextableToPage <- function(ft, pgwidth = 6){ ft_out <- ft %>% autofit() ft_out <- width(ft_out, width = dim(ft_out)$widths*pgwidth /(flextable_dim(ft_out)$widths)) return(ft_out)}# Create an empty data frame with a column named "year"params <- data.frame(year = numeric(0))# Add the value 2021 to the "year" columnparams <- rbind(params, data.frame(year = 2023))min_year = min(cook_sums$year)max_year = max(cook_sums$year)cmap_colors = c("#1e478e", "#6dae4f", "#d3b42b", "#008fd5", "#ca3428", "#ade0ee", "#3e6730", "#d0e4a4")alea_theme <- function() { font <-"Whitney" ggplot2::theme( legend.position = "bottom", # legend.title = element_blank, panel.background = ggplot2::element_blank(), panel.grid.minor.x = ggplot2::element_blank(), panel.grid.major.y = element_line(color = "grey"), panel.grid.minor.y = element_line(color = "grey", linetype = "dashed"), # panel.grid.major.x = ggplot2::element_blank(), axis.ticks = element_line(color = "gray"), axis.ticks.x = element_blank() )}```## Time Trends - All YearsThe file `comm_ind_inmunis_timeseries_2006to2023.csv` contains all PINs that had an incentive property class for at least 1 year. It includes all observations for a property during the years that it existed, even if it is not an incentive class property in that year. Only includes PINs in incorporated areas. ### FMV```{r}year_count <-13comm_ind_pins <-read_csv("../Output/comm_ind_PINs_2006to2023_timeseries.csv")``````{r}#| label: tbl-Report-Table2-allyears#| tbl-cap: "**Table 2 in Incentive Report** Incentive FMV by Year, 2006 to 2023"commind_together_fmv <- comm_ind_pins %>%filter(land_use %in%c("Industrial", "Commercial")) |>group_by(year) %>%mutate(fmv = fmv /1000000000)|>summarize(fmv_CI =sum(fmv, na.rm=TRUE),fmv_incent =sum(ifelse(incent_prop =="Incentive", fmv, 0)) ) %>%mutate(pct_incent = (fmv_incent / fmv_CI))table_fmv <- comm_ind_pins %>%filter(land_use %in%c("Industrial", "Commercial")) |>mutate(fmv = fmv /1000000000)|>group_by(year, land_use) %>%summarize(fmv_incent =sum(ifelse(incent_prop =="Incentive", fmv, 0), na.rm=TRUE),fmv =sum(fmv, na.rm=TRUE), ) %>%mutate(pct_incent = (fmv_incent / fmv)) %>%arrange(year) %>%select(year, land_use, fmv_incent, pct_incent) |>pivot_wider(id_cols = year, names_from = land_use, values_from =c(fmv_incent, pct_incent)) %>%ungroup() |>select(-year)Table2_allyears <-cbind(commind_together_fmv, table_fmv) %>%select(Year = year, "C&I Incentive FMV"= fmv_incent, "Share of C&I"= pct_incent,"Commercial Incent. FMV"= fmv_incent_Commercial, "Share of Commercial"= pct_incent_Commercial,"Industrial Incent. FMV"= fmv_incent_Industrial, "Share of Industrial"= pct_incent_Industrial, "C&I FMV"= fmv_CI) %>%mutate(Year =as.character(Year)) %>%mutate(across(contains("Share"), scales::percent, accuracy =0.01)) |>mutate(across(is.numeric, round, digits =2))Table2_allyears |>flextable() %>%add_header_row(values =c(" ", "Commercial & Industrial", "Commercial", "Industrial","All C&I"), colwidths =c(1, 2, 2, 2, 1)) |>align(align ="right", part ="body" ) |>align(align ="center", part ="header") |>align(j =1, align =c("left"), part ="all" )``````{r}#| label: fig-Report-Figure2-allyears#| fig-cap: "**Similar to Figure 2 in Incentive Report** Incentive FMV by Year, All Years"Figure1_allyears <- comm_ind_pins %>%filter(land_use %in%c("Commercial", "Industrial")) %>%group_by(year, land_use) %>%summarize(fmv =sum(ifelse(incent_prop=="Incentive", fmv/1000000000, 0) ))Figure1_allyears %>%ggplot() +geom_col(aes(x=year, y = fmv, fill = land_use)) +scale_x_continuous(limits =c(min_year -1, max_year +1), breaks =c(min_year, 2010, 2015, 2020, max_year)) +scale_y_continuous(breaks =c(0, 5, 10, 15)) +alea_theme() +labs(y ="FMV ($ Billions)")+theme(legend.position ="bottom", legend.title =element_blank(), axis.title.x =element_blank())+scale_fill_manual(values = cmap_colors )``````{r}#| label: fig-fmvgrowth-allyears#| fig-cap: "**Similar to Appendix Figure in Incentive Report** Incentive FMV Growth, All Years. Indexed to 2011."Appendix_Figure_FMVgrowth_allyears <- comm_ind_pins %>%filter(incent_prop =="Incentive") %>%reframe(fmv,type_fmv =sum(fmv, na.rm=TRUE), .by =c(year,land_use) ) %>%reframe(land_use, type_fmv,fmv_incent =sum(fmv, na.rm=TRUE), .by=year) %>%distinct() %>%arrange(year) %>%group_by(land_use) %>%mutate(ratio_2011 = type_fmv/ type_fmv[year==2011],ratio_both_2011 = fmv_incent/fmv_incent[year==2011]) Appendix_Figure_FMVgrowth_allyears %>%ggplot() +scale_color_manual(values =c("#1E478E", "#6DAE4F", "#D0E4A4") )+geom_line(aes(x=year, y = ratio_2011, group = land_use, color = land_use, ), lwd =1) +geom_line(aes(x=year, y =ratio_both_2011), lty =2, lwd=1 ) +scale_y_continuous(labels= scales::percent) +scale_x_continuous(limits =c(min_year -1, max_year +1), breaks =c(min_year, 2010, 2015, 2020, max_year)) +alea_theme() +labs(title ="FMV Growth for Properties with Incentives, Indexed to 2011", color =element_blank(),x =element_blank(), y ="Percent of 2011 FMV",caption ="Dashed line represents C&I Incentive FMV Growth. \n As more PINs receive incentive classification, their aggregate FMV increases. This automatically makes it look like the FMV growth is increasing, but the number of PINs also increased over time. ")```### PIN Counts```{r}commind_together <- comm_ind_pins %>%group_by(year) %>%summarize(proptype_pincount =n(),n_incent =sum(ifelse(incent_prop =="Incentive", 1, 0)),n_nonincent =sum(ifelse(incent_prop =="Non-Incentive", 1, 0))) %>%mutate(pct_incent = n_incent / proptype_pincount)``````{r}#| label: pincounts-allyears#| column: marginPinCount_data_allyears <- comm_ind_pins %>%filter(land_use %in%c("Commercial", "Industrial")) %>%group_by(year, land_use) %>%summarize(PC =sum(incent_prop=="Incentive") )PinCount_data_allyears %>%ggplot() +geom_col(aes(x=year, y = PC, fill = land_use)) +scale_x_continuous(limits =c(min_year -1, max_year +1), breaks =c(min_year, 2010, 2015, 2020, max_year )) +alea_theme() +theme(legend.position ="bottom", legend.title =element_blank(), axis.title.x =element_blank())+scale_fill_manual(values = cmap_colors ) +ggtitle("Count of Incentive PINs")``````{r}#| label: fig-pincount#| column: marginAppendix_PinCount_growth_allyears <- comm_ind_pins %>%filter(incent_prop =="Incentive") %>%reframe(PC=n(), .by=c(year, land_use)) %>%distinct() %>%reframe(land_use, PC,both_PC =sum(PC), .by=year) %>%distinct() %>%arrange(year) %>%group_by(land_use) %>%mutate(ratio_2011 = PC/ PC[year==2011],ratio_both_2011 = both_PC/both_PC[year==2011])Appendix_PinCount_growth_allyears %>%ggplot() +scale_color_manual(values = cmap_colors)+geom_line(aes(x=year, y = ratio_2011, group = land_use, color = land_use), lwd=1 ) +geom_line(aes(x=year, y =ratio_both_2011), lty =2, lwd =1) +alea_theme() +scale_x_continuous(limits =c(min_year -1, max_year +1), breaks =c(min_year, 2010, 2015, 2020, max_year)) +scale_y_continuous(name ="Percent of 2011 Pin Count", label = scales::percent) +labs(title ="Number of PINs, Indexed to 2011",x =NULL,caption ="Dashed line represents growth in the number of commercial and industrial PINs",color =NULL)``````{r}#| label: tbl-pincountsallyears#| tbl-cap: "Descriptive stats for PINs with incentive classifications - Using Count of PINs"table <- comm_ind_pins %>%filter(land_use %in%c("Industrial", "Commercial")) |>group_by(year, land_use) %>%summarize(proptype_pincount =n(),n_incent =sum(ifelse(incent_prop =="Incentive", 1, 0)),n_nonincent =sum(ifelse(incent_prop =="Non-Incentive", 1, 0))) %>%mutate(pct_incent = n_incent / proptype_pincount) %>%arrange(year) %>%mutate(year =as.character(year)) %>%filter(!land_use %in%c("Exempt", "Other Residential", "Owner Occupied", "Rental") ) %>%select(year, land_use, n_incent, pct_incent) |>pivot_wider(id_cols = year, names_from = land_use, values_from =c(n_incent,pct_incent)) %>%ungroup() |>select(-year)Appendix_PinCount_allyears <-cbind(commind_together, table) %>%select(Year = year, "C&I Incentive Parcels"= n_incent, "Share of C&I"= pct_incent,"Commercial Pin Count"= n_incent_Commercial, "Share of Commercial"= pct_incent_Commercial,"Industrial Pin Count"= n_incent_Industrial, "Share of Industrial"= pct_incent_Industrial,"C&I PIN Count"= proptype_pincount) %>%mutate(Year =as.character(Year)) |>mutate(across(contains("Share"), scales::percent, #digits = 2 ## doesn't work!! accuracy =0.01)) Appendix_PinCount_allyears |>flextable() %>%add_header_row(values =c(" ", "Incent C&I", "Commercial", "Industrial","All C&I"), colwidths =c(1,2,2,2, 1)) |>align(align ="right", part ="body" ) |>align(align ="center", part ="header") |>align(j =1, align =c("left"), part ="all" )```### Change in Incentive Classification```{r}#| label: tbl-categorycountsforcomparison-2023#| tbl-cap: "Number of PINs that gain or lose incentive classification each year."pins_per_year <- comm_ind_pins %>%mutate(Year =as.character(year)) |>group_by(Year) %>%summarize("Gains Incent"=sum(gain_incent, na.rm=TRUE),"Loses Incent"=sum(lose_incent, na.rm=TRUE),"PINs with Incent. Class."=sum(incent_prop=="Incentive"),"PINs in Sample"=n(),# "Became Exempt" = sum(became_exempt, na.rm=TRUE) )pins_per_year |>flextable()``````{r}#| include: falsedf_2011_class8change <- comm_ind_pins|>group_by(pin) |>mutate(class8years =sum(class_1dig ==8)) |>mutate(class8_change =case_when( class8years == year_count ~"Always Class 8", class8years ==0~"Never Class 8",TRUE~"Changes to or from C8") ) |>ungroup() |>group_by(year, class8_change) |>summarize(group_pin_count =n(),group_year_fmv =sum(fmv, na.rm=TRUE), ) |>ungroup() |>group_by( class8_change) %>%mutate(base_year_fmv = group_year_fmv[year ==min(year)],fmv_group_growth = (group_year_fmv / base_year_fmv) -1) # df_2011_class8change %>% # filter(year == 2022) %>%# select(class8_change, fmv_group_growth, base_year_fmv, group_year_fmv, everything(), -year)df_2011_class8change %>%filter(year ==2023) %>%select(class8_change, fmv_group_growth, base_year_fmv, group_year_fmv, everything(), -year)``````{r}#| label: tbl-class8eachyear-2023#| tbl-cap: "Number of PINs that became each major class type each year."comm_ind_pins <- comm_ind_pins %>%group_by(pin) |>mutate(year =as.character(year), class8years =sum(class_1dig ==8),class8_change =case_when( class8years == year_count ~"Always Class 8", class8years ==0~"Never Class 8",sum(lag(class_1dig) !=8& class_1dig ==8) >0~"Becomes Class 8",sum(class_1dig !=8&lag(class_1dig) ==8 ) >0~"Leaves Class 8",TRUE~"Other"),becomes8 =ifelse(lag(class_1dig) !=8& class_1dig ==8, 1, 0),becomes7 =ifelse(lag(class_1dig) !=7& class_1dig ==7, 1, 0),becomes6 =ifelse(lag(class_1dig) !=6& class_1dig ==6, 1, 0),switches_to8 =ifelse( (lag(class_1dig) ==7|lag(class_1dig) ==6 )& becomes8 ==1, 1, 0), ) %>%ungroup() Appendix_Table_Class8PINs <- comm_ind_pins |>group_by(year) %>%summarize("Becomes 8"=sum(becomes8==1, na.rm=TRUE),"Total 8"=sum(class_1dig ==8),"6 or 7 to 8"=sum(switches_to8 ==1, na.rm=TRUE),"Becomes 7"=sum(becomes7 ==1, na.rm=TRUE),"Total 7"=sum(class_1dig ==7),"Becomes 6"=sum(becomes6 ==1, na.rm=TRUE),"Total 6"=sum(class_1dig ==6),"PINs with Incent. Class."=sum(incent_prop=="Incentive"),"PINs in Sample"=n(), )Appendix_Table_Class8PINs |> flextable::flextable()``````{r}#| label: tbl-construction-onvacant#| tbl-cap: "Development on vacant parcels with and without incentive classes."comm_ind_pins <- comm_ind_pins %>%group_by(pin) |>mutate(new_dev =ifelse(lag(class_1dig) ==1&!class_1dig %in%c(0, 1), 1, 0),new_dev_w_incent =ifelse(lag(class_1dig) ==1&!class_1dig %in%c(0, 1) & incent ==1, 1, 0), became_exempt =ifelse(class_1dig ==0&lag(class_1dig)!=0, 1, 0),became_taxed =ifelse(class_1dig !=0&lag(class_1dig)==0, 1, 0), ) %>%ungroup()Table_newconstruction <- comm_ind_pins |>group_by(year) %>%summarize("New Construction"=sum(new_dev ==1, na.rm = T),"New Construction w/ Incentive"=sum(new_dev_w_incent ==1, na.rm = T), "Gained Incentive"=sum(gain_incent ==1, na.rm = T), "Incentive Ends"=sum(lose_incent ==1, na.rm = T),"Becomes 8"=sum(becomes8==1, na.rm=TRUE),"PINs with Incent. Class."=sum(incent_prop=="Incentive"),"PINs in Sample"=n(),"Became Exempt"=sum(became_exempt, na.rm=TRUE), "Became Taxed"=sum(became_taxed, na.rm=TRUE) )Table_newconstruction %>% flextable::flextable()``````{r}#| layout-ncol: 2#| layout-nrow: 2#| eval: false# Trends in Incentivized FMV as a percent of the base over time## Data prepmuni_MC <-read_csv("../Output/ptaxsim_muni_class_summaries_2006to2023.csv") %>%select(year, clean_name, class, av = muni_c_av)class_dict <-read_csv("../Necessary_Files/class_dict_expanded.csv") %>%select(class = class_code, class_1dig, assess_ratio, incent_prop, land_use=Alea_cat, major_class_code)muni_MC <- muni_MC %>%left_join(class_dict, by =c("class")) %>%filter(class !=0) # drop exempt property types with 0 taxable value#class_8_munis <- read_csv("./Necessary_Files/datarequests_Class8Munis.csv")class_8_munis <-read_csv("../Output/datarequests_Class8Munis.csv")# changed from as.list to as.characterclass_8_munis <-as.character(class_8_munis$clean_name)# class 8 munis - at the year-class levelclass_8_df <-# left_join(muni_MC, class_dict, by = "class") %>% muni_MC %>%filter(clean_name %in% class_8_munis) %>%filter(av !=0) %>%mutate(FMV = av/assess_ratio) %>%group_by(year) %>%mutate(year_tb_tot =sum(FMV)) %>%# tax base for all class 8 munis together, per yearungroup() %>%filter(land_use %in%c("Industrial", "Commercial")) %>%## drops all non-industrial and non-commercial classes to calculate the rest of the totalsgroup_by(year) %>%mutate(year_ind_comm_FMV =sum(FMV)) %>%# total commercial and industrial FMV for all class 8 munis together, per yearungroup() %>%group_by(year, clean_name) %>%mutate(muni_year_ind_comm_FMV =sum(FMV)) %>%# calculates total FMV in each munis each yearungroup() %>%group_by(year, land_use) %>%mutate(cat_year_FMV =sum(FMV)) %>%# calculates FMV within each commercial vs industrial category for each yearungroup() %>%group_by(year, clean_name, class_1dig) %>%# total fmv in class 5, 6, 7, and 8 per munimutate(year_muni_class_FMV =sum(FMV))## Added this for cook level totals:class_8_df_outofCook <- muni_MC %>%# filter(clean_name %in% class_8_munis) %>% ## keep all munis, use for cook county totals.filter(av !=0) %>%mutate(FMV = av/assess_ratio) %>%group_by(year) %>%mutate(year_tb_tot =sum(FMV)) %>%# tax base for all class 8 munis together, per yearungroup() %>%filter(land_use %in%c("Industrial", "Commercial")) %>%## drops all non-industrial and non-commercial classes to calculate the rest of the totalsgroup_by(year) %>%mutate(year_ind_comm_FMV =sum(FMV)) %>%# total commercial and industrial FMV for all class 8 munis together, per yearungroup() %>%group_by(year, clean_name) %>%mutate(muni_year_ind_comm_FMV =sum(FMV)) %>%# calculates total FMV in each munis each yearungroup() %>%group_by(year, land_use) %>%mutate(cat_year_FMV =sum(FMV)) %>%# calculates FMV within each commercial vs industrial category for each yearungroup() %>%group_by(year, clean_name, class_1dig) %>%# total fmv in class 5, 6, 7, and 8 per munimutate(year_muni_class_FMV =sum(FMV))## Class 8 Townships Graph -------------------## Alea Version: ggplot() +geom_line(data = class_8_df %>%group_by(year) %>%summarize(ind_comm_perc =mean(year_ind_comm_FMV/year_tb_tot)), aes(x = year, y = ind_comm_perc, color ="Commercial+Industrial"), lwd =1) +# industrial fmvgeom_line(data = class_8_df %>%filter(land_use =="Industrial") %>%group_by(year) %>%# needed na.rm=TRUE, otherwise it didn't work. perc_industrial was not being calculated without it.summarize(perc_industrial =sum(FMV/year_tb_tot, na.rm=TRUE)), ## added this partaes(x = year, y = perc_industrial, color ="Industrial"), lwd =1) +# commercial fmvgeom_line(data = class_8_df %>%filter(land_use =="Commercial") %>%group_by(year) %>%summarize(perc_commercial =sum(FMV/year_tb_tot, na.rm=TRUE)), ## added this partaes(x = year, y = perc_commercial, color ="Commercial"), lwd =1) +geom_line(data = class_8_df %>%filter(incent_prop =="Incentive") %>%group_by(year) %>%summarise(incent_perc =sum(FMV)/year_tb_tot),aes(x = year, y = incent_perc, color ="Incentive Classes"), lwd =1 ) +geom_line(data = class_8_df %>%# threw error here, missing x and y in aes()filter(class_1dig ==8) %>%group_by(year) %>%summarize(perc_8 =sum(FMV/year_tb_tot)), ## added this partaes(x = year, y = perc_8, color ="Class 8"), lwd =1) +# was missing a + sign heretheme_classic() +scale_x_continuous(name ="", breaks =seq(2006, 2022, by =3), limits =c(2006, 2022), expand =c(0,0)) +scale_y_continuous(name ="Percent of FMV", labels = scales::percent_format(), limits =c(0, 0.20),breaks =seq(0, 0.5, by =0.05), expand =c(0,0)) +scale_color_manual(name ="", values =c("Commercial+Industrial"="black", "Industrial"="gray70", "Commercial"="gray50", "Incentive Classes"="orange", "Class 8"="red" )) +theme(legend.position ="bottom") +labs(title ="Property in the Class 8 Townships") +guides(color =guide_legend(nrow=2, byrow =TRUE))## Percentage out of Cook County ---------------------## Alea Version for Cook Level: ggplot() +# Commercial + Industrial FMV in cookgeom_line(data = class_8_df_outofCook %>%group_by(year) %>%#didn't group by year before?summarize(ind_comm_perc =mean(year_ind_comm_FMV/year_tb_tot)), aes(x = year, y = ind_comm_perc, color ="Commercial+Industrial"), lwd =1) +# incentive class properties in cookgeom_line(data = class_8_df_outofCook %>%filter(incent_prop =="Incentive") %>%group_by(year) %>%summarise(incent_perc =sum(FMV/year_tb_tot)),aes(x = year, y = incent_perc, color ="Incentive Classes"), lwd =1 ) +# FMV with class 8 property class in cook countygeom_line(data = class_8_df_outofCook %>%# threw error here, missing x and y in aes()filter(class_1dig ==8) %>%group_by(year) %>%summarize(perc_8 =sum(FMV/year_tb_tot)), ## added this partaes(x = year, y = perc_8, color ="Class 8"), lwd =1) +# was missing a + sign here# industrial fmv in cook countygeom_line(data = class_8_df_outofCook %>%# threw error here, missing x and y in aes()filter(land_use =="Industrial") %>%group_by(year) %>%# needed na.rm=TRUE, otherwise it didn't work. perc_industrial was not being calculated without it.summarize(perc_industrial =sum(FMV/year_tb_tot, na.rm=TRUE)), ## added this partaes(x = year, y = perc_industrial, color ="Industrial"), lwd =1) +# commercial fmv in cook countygeom_line(data = class_8_df_outofCook %>%# threw error here, missing x and y in aes()filter(land_use =="Commercial") %>%group_by(year) %>%summarize(perc_commercial =sum(FMV/year_tb_tot, na.rm=TRUE)), ## added this partaes(x = year, y = perc_commercial, color ="Commercial"), lwd =1) +# make it pretty:theme_classic() +scale_x_continuous(name ="", breaks =seq(2006, 2022, by =3), limits =c(2006, 2022), expand =c(0,0)) +scale_y_continuous(name ="Percent of County FMV", labels = scales::percent_format(), limits =c(0, 0.20), breaks =seq(0, 0.5, by =0.05), expand =c(0,0)) +scale_color_manual(name ="", values =c("Commercial+Industrial"="black", "Industrial"="gray80", "Commercial"="gray40", "Incentive Classes"="orange", "Class 8"="red")) +theme(legend.position ="bottom") +labs(title="Cook County Commercial & Industrial FMV") +guides(color =guide_legend(nrow=2, byrow =TRUE))## Newest Addition for April 30th Presentation --------------------ggplot() +# incentive class properties in cookgeom_line(data = class_8_df_outofCook %>%filter(incent_prop =="Incentive") %>%group_by(year) %>%summarise(incent_perc =sum(FMV/year_ind_comm_FMV)),aes(x = year, y = incent_perc, color ="Incentive Classes"), lwd =1 ) +# FMV with class 8 property class in cook countygeom_line(data = class_8_df_outofCook %>%filter(class_1dig ==8) %>%group_by(year) %>%summarize(perc_8 =sum(FMV/year_ind_comm_FMV)), aes(x = year, y = perc_8, color ="Class 8"), lwd =1) +# make it pretty:theme_classic() +scale_x_continuous(name ="", breaks =seq(2006, 2022, by =3), limits =c(2006, 2022), expand =c(0,0)) +scale_y_continuous(name ="Percent of Com+Ind FMV", labels = scales::percent_format(), limits =c(0, 0.25), breaks =seq(0, 0.5, by =0.05), expand =c(0,0)) +scale_color_manual(name ="", values =c("Industrial"="gray80", "Commercial"="gray40", "Incentive Classes"="orange", "Class 8"="red")) +theme(legend.position ="bottom") +labs(title="Cook County", subtitle ="Share of Commercial & Industrial FMV with Incentive Classification") +guides(color =guide_legend(nrow=2, byrow =TRUE))## Newest Addition for April 30th Presentation --------------------ggplot() +# incentive class properties in cookgeom_line(data = class_8_df_outofCook %>%filter(incent_prop =="Incentive") %>%group_by(year) %>%summarise(incent_perc =sum(FMV/year_ind_comm_FMV)),aes(x = year, y = incent_perc, color ="Incentive Classes"), lwd =1 ) +# # # FMV with class 8 property class in cook county# geom_line(data = class_8_df_outofCook %>% # filter(class_1dig == 8) %>% # group_by(year) %>%# summarize(perc_8 = sum(FMV/year_ind_comm_FMV)), # aes(x = year, y = perc_8, color = "Class 8"), lwd = 1) + # make it pretty:theme_classic() +scale_x_continuous(name ="", breaks =seq(2006, 2022, by =3), limits =c(2006, 2022), expand =c(0,0)) +scale_y_continuous(name ="Percent of Com+Ind FMV", labels = scales::percent_format(), limits =c(0, 0.25), breaks =seq(0, 0.5, by =0.05), expand =c(0,0)) +scale_color_manual(name ="", values =c("Industrial"="gray80", "Commercial"="gray40", "Incentive Classes"="orange")) +theme(legend.position ="bottom") +labs(title="Cook County", subtitle ="Share of Commercial & Industrial FMV with Incentive Classification") +guides(color =guide_legend(nrow=2, byrow =TRUE))ggplot() +geom_line(data = class_8_df %>%filter(incent_prop =="Incentive") %>%group_by(year) %>%summarise(incent_perc =sum(FMV/year_ind_comm_FMV)),aes(x = year, y = incent_perc, color ="All Incentive Classes"), lwd =1 ) +geom_line(data = class_8_df %>%filter(class_1dig ==8) %>%group_by(year) %>%summarize(perc_8 =sum(FMV/year_ind_comm_FMV)), aes(x = year, y = perc_8, color ="Class 8"), lwd =1) +# make it pretty:theme_classic() +scale_x_continuous(name ="", breaks =seq(2006, 2022, by =3), limits =c(2006, 2022), expand =c(0,0)) +scale_y_continuous(name ="Percent of Com&Ind FMV", labels = scales::percent_format(), # limits = c(0, 0.25), breaks =seq(0, 0.5, by =0.05), expand =c(0,0)) +scale_color_manual(name ="", values =c("Commercial+Industrial"="black", "Industrial"="gray80", "Commercial"="gray40", "All Incentive Classes"="orange", "Class 8"="red")) +theme(legend.position ="bottom") +labs(title="Class 8 Townships", subtitle ="Share of Commercial & Industrial FMV with Incentive Classification") +guides(color =guide_legend(nrow=2, byrow =TRUE))```### Commercial and Industrial Growth```{r}#| label: tbl-incentchange-2023indexed#| tbl-cap: "Aggregate FMV Growth by Incentive Classification. `Changes Sometime` includes properties that gained or lost an incentive classification. `incent_status` in tables below breaks up Changes Sometime into more detailed categories. "df_2011_incentchange <- comm_ind_pins|>group_by(year, incent_change) |>summarize(group_pin_count =n(),group_year_fmv =sum(fmv, na.rm=TRUE), ) |>ungroup() |>group_by( incent_change) %>%mutate(base_year_fmv = group_year_fmv[year ==min(year)],fmv_group_growth = (group_year_fmv / base_year_fmv) -1) df_2011_incentchange %>%filter(year == max_year) |>select("Gains/Loses Incentive Classification"= incent_change, "FMV Growth"= fmv_group_growth, "2006 FMV\n(Billions)"= base_year_fmv, "Aggregate FMV\n(Billions)"= group_year_fmv, "PIN Count"= group_pin_count, -year) |>mutate(across(contains("Growth"), scales::percent, accuracy =0.01)) |>mutate(across(2:3, ~round((./1000000000), digits =3)) )|>flextable() %>%align(align ="right", part ="body" ) |>align(align ="center", part ="header") |>align(j =1, align =c("left"), part ="all" )``````{r}#| label: tbl-growthcalculations-byincentstatus-2023#| tbl-cap: "Aggregate FMV Growth by `incent_status`. Calculations for PINs counts in header of table in report. Always Had Incentive and Never Had Incentive should be identical to table above."comm_ind_pins %>%ungroup() %>%group_by(year, incent_status) |>summarize(group_pin_count =n(),group_year_fmv =sum(fmv, na.rm=TRUE)) |>ungroup() |>group_by(incent_status) %>%mutate(base_year_fmv = group_year_fmv[year ==min(year)],fmv_group_growth = (group_year_fmv / base_year_fmv) -1) |>filter(year == params$year) %>%select("Incentive Status"= incent_status, "FMV Growth"= fmv_group_growth, "2006 FMV\n(Billions)"= base_year_fmv, "Aggregate FMV\n(Billions)"= group_year_fmv, "PIN Count"= group_pin_count, -year) |>mutate(across(contains("Growth"), scales::percent, accuracy =0.01)) |>mutate(across(2:3, ~round((./1000000000), digits =3)) )|>flextable() %>%align(align ="right", part ="body" ) |>align(align ="center", part ="header") |>align(j =1, align =c("left"), part ="all" )``````{r}#| label: tbl-growthcalculations-bylandusechange-2023#| tbl-cap: !expr paste0("Aggregate FMV Growth from 2006 to ", params$year, " by `landuse_change`." )comm_ind_pins %>%group_by(year, landuse_change) |>summarize(group_pin_count =n(),group_year_fmv =sum(fmv, na.rm=TRUE)) |>ungroup() |>group_by(landuse_change) %>%mutate(base_year_fmv = group_year_fmv[year ==min(year)],base_year_n = group_pin_count[year ==min(year)],n_group_growth = group_pin_count/base_year_n -1,fmv_group_growth = (group_year_fmv / base_year_fmv) -1) %>%filter(year == params$year) %>%select("Changes Land Use"= landuse_change, "FMV Growth"= fmv_group_growth, "2006 FMV\n(Billions)"= base_year_fmv, "Aggregate FMV\n(Billions)"= group_year_fmv, "PIN Count"= group_pin_count, -year) |>mutate(across(contains("Growth"), scales::percent, accuracy =0.01)) |>mutate(across(2:3, ~round((./1000000000), digits =3)) )|>flextable() %>%align(align ="right", part ="body" ) |>align(align ="center", part ="header") |>align(j =1, align =c("left"), part ="all" )``````{r}#| label: create-df2011baldf_2011_bal <- comm_ind_pins %>%group_by(year, landuse_change, incent_status) |>summarize(group_pin_count =n(),group_year_fmv =sum(fmv, na.rm=TRUE)) |>ungroup() |>group_by(landuse_change, incent_status) %>%mutate(base_year_fmv = group_year_fmv[year ==min(year)],base_year_n = group_pin_count[year ==min(year)],n_group_growth = group_pin_count/base_year_n -1,fmv_group_growth = (group_year_fmv / base_year_fmv) -1) ``````{r}#| label: tbl-growthcalculations-landusechange-incentstatus-balanced-2023#| tbl-cap: !expr paste0("Growth from 2006 to ", params$year, " - Change in Land Use by Incentive Class Status. Non-winsorized version of table.")df_2011_bal %>%select(year, landuse_change, incent_status, fmv_group_growth, group_pin_count) %>%filter(year == params$year) %>%select("Changes Land Use"= landuse_change,"Incentive Status"= incent_status,"FMV Growth"= fmv_group_growth, "PIN Count"= group_pin_count, -year) |>mutate(across(contains("Growth"), scales::percent, accuracy =0.01)) |> DT::datatable(rownames =FALSE, options =list(dom ='tp'))``````{r}#| label: fig-landusebyincentstatus-2023#| fig-cap: "Includes the 'Excluded' Category. For comparison only to show what was excluded in next image."#| column: margindf_2011_bal %>%mutate(year =as.numeric(year)) |>ggplot() +geom_line(aes(x=year, fmv_group_growth, group = incent_status, color = incent_status), lwd =1) +theme_bw() +scale_y_continuous(labels = scales::percent)+scale_color_manual(values = cmap_colors) +scale_x_continuous(limits =c(2005, 2024), breaks =c(2006, 2015, 2023)) +theme( panel.background = ggplot2::element_blank(),panel.grid.minor.x = ggplot2::element_blank(),panel.grid.major.x = ggplot2::element_blank(),panel.grid.major.y =element_line(color ="grey"),panel.grid.minor.y =element_line(color ="grey", linetype ="dashed"),axis.ticks =element_line(color ="gray"),axis.ticks.x =element_blank(),legend.position ="bottom") +labs(title ="FMV Growth for Properties with Incentives, Indexed to 2006", color =element_blank(),x =element_blank(), y ="FMV Growth since 2006",caption ="Broken into subcategories to keep sample size the same over time.") +facet_wrap(~landuse_change)``````{r}#| label: fig-landusebyincentstatus-clean-2023#| fig-cap: "Excludes the 'Excluded' Category and 'Exempt Sometime' properties."df_2011_bal %>%mutate(year =as.numeric(year)) |>filter(incent_status !="Excluded"& landuse_change !="Excluded"& landuse_change !="Exempt Sometime") %>%ggplot() +geom_line(aes(x=year, fmv_group_growth, group = incent_status, color = incent_status), lwd=1) +# labs( title = "FMV Growth Since 2011 by Land Use", # caption = "PINs that did not exist during all years of the sample frame were excluded from the image (n=10,809)."# ) + theme_bw() +scale_y_continuous(labels = scales::percent)+scale_color_manual(values = cmap_colors) +theme( panel.background = ggplot2::element_blank(),panel.grid.minor.x = ggplot2::element_blank(),panel.grid.major.x = ggplot2::element_blank(),panel.grid.major.y =element_line(color ="grey"),panel.grid.minor.y =element_line(color ="grey", linetype ="dashed"),axis.ticks =element_line(color ="gray"),axis.ticks.x =element_blank(),legend.position ="bottom") +facet_wrap(~landuse_change) +scale_x_continuous(limits =c(2005, 2024), breaks =c(2006, 2015, 2023)) +labs(title ="FMV Growth for Properties with Incentives, Indexed to 2006", color =element_blank(),x =element_blank(), y ="FMV Growth since 2006",caption ="Broken into subcategories to keep sample size the same over time.")``````{r}#| label: fig-growth-facetby-incentstatus-2023#| fig-cap: !expr paste0("Growth from 2006 to ", params$year, ". Faceted by if a PIN changed landuse during the sample period. Indexed to fair market value during 2011. **Only for comparison to show what has been dropped in the next image.**")#| column: margindf_2011_bal %>%mutate(year =as.factor(year)) %>%ggplot() +geom_line(aes(x=year, y=fmv_group_growth, group = landuse_change, color = landuse_change), lwd =1) +theme_bw() +facet_wrap(~incent_status, nrow =1) +scale_x_discrete(#limits = c(2005, 2024), breaks =c(2006, params$year)) +scale_y_continuous(labels = scales::percent) +scale_color_manual(values = cmap_colors) +labs(title=paste0("Growth from 2006 to ", params$year),subtitle ="Incentive Classification Status by Land Use Change",y ="FMV Growth", x =NULL,caption ="Values are indexed to 2006 FMV") +theme( panel.background = ggplot2::element_blank(),panel.grid.minor.x = ggplot2::element_blank(),panel.grid.major.x = ggplot2::element_blank(),panel.grid.major.y =element_line(color ="grey"),panel.grid.minor.y =element_line(color ="grey", linetype ="dashed"),axis.ticks =element_line(color ="gray"),axis.ticks.x =element_blank(),legend.position ="bottom",legend.title =element_blank())``````{r}#| label: fig-growth-facetby-incentstatus-clean-2023#| fig-cap: !expr paste0("Aggregate FMV Growth from 2006 to ", params$year, ". Faceted by PIN incentive status during the sample period. Indexed to fair market value during 2006.")df_2011_bal %>%filter(landuse_change !="Excluded"& incent_status !="Excluded"& landuse_change !="Exempt Sometime") %>%mutate(year =as.numeric(year)) %>%select(year, fmv_group_growth, landuse_change) |>ggplot() +geom_line(aes(x=year, y=fmv_group_growth, group = landuse_change, color = landuse_change), lwd =1) +theme_bw() +facet_wrap(~incent_status, nrow =1) +scale_x_continuous(limits =c(min_year-1, max_year+1),breaks =c(min_year, 2015, max_year)) +scale_y_continuous(labels = scales::percent) +scale_color_manual(values = cmap_colors) +labs(title="Growth from 2006", subtitle ="Incentive Classification Status by Land Use Change",y ="FMV Growth since 2006", x =NULL,caption =paste0("Values are indexed to 2006 FMV. Excludes PINs that were tax exempt some years or did not exist for all years between 2006 and ", params$year)) +theme( panel.background = ggplot2::element_blank(),panel.grid.minor.x = ggplot2::element_blank(),panel.grid.major.x = ggplot2::element_blank(),panel.grid.major.y =element_line(color ="grey"),panel.grid.minor.y =element_line(color ="grey", linetype ="dashed"),axis.ticks =element_line(color ="gray"),axis.ticks.x =element_blank(),legend.position ="bottom",legend.title =element_blank())```### Explore PINs that became Class 8 or Other Incentive in South Triad```{r}#| label: tbl-class8eachyearsouthtriad-2023#| tbl-cap: "Number of PINs that became each major class 8 in the South triad."#| eval: false#| include: false#| # comm_ind_pins %>% # filter(class8_change == "Becomes Class 8") %>% # left_join(bor, by = c("pin", "year" = "tax_year")) %>%# filter(!is.na(appellant)) %>%# # arrange(pin, desc(year)) %>%# select(year, appellant, project_id, class.x, everything())# example of PIN that was class 8 and then became un-incentivized in 2017# comm_ind_pins %>% filter(pin == "16271000330000")comm_ind_pins %>%filter(class8_change =="Becomes Class 8"& Triad =="South") %>%arrange(pin) %>%select(year, class, everything())``````{r}#| label: tbl-southtriadpins2023#| tbl-cap: "South Triad Number of PINs that became each major class type each year."#| layout-ncol: 3#| tbl-cap-location: topcomm_ind_pins %>%filter(becomes8 ==1& Triad =="South") %>%arrange(pin) %>%select(year, class, everything())comm_ind_pins %>%filter(becomes7==1& Triad =="South") %>%arrange(pin) %>%select(year, class, everything())comm_ind_pins %>%filter(becomes6 ==1& Triad =="South") %>%arrange(pin) %>%select(year, class, everything())```## Trends for Incentive Report - FMV Growth 2011-2022The file `comm_ind_PINs_2011to2022_timeseries.csv` contains all PINs that had an incentive property class for at least 1 year. It includes all observations for a property during the years that it existed, even if it is not an incentive class property in that year.Only includes PINs in incorporated areas. ```{r}# Create an empty data frame with a column named "year"params <-data.frame(year =numeric(0))# Add the value 2021 to the "year" columnparams <-rbind(params, data.frame(year =2022))year_count <-12comm_ind_pins <-read_csv("../Output/comm_ind_PINs_2011to2022_timeseries.csv")min_year =2011max_year =2022```### FMV```{r}#| label: tbl-Report-Table2#| tbl-cap: "**Incentive FMV by Year, 2011-2022**"commind_together_fmv <- comm_ind_pins %>%filter(land_use %in%c("Industrial", "Commercial")) |>group_by(year) %>%summarize(fmv_incent =sum(ifelse(incent_prop =="Incentive", fmv, 0)),fmv_CI =sum(fmv, na.rm=TRUE) ) %>%mutate(pct_incent = (fmv_incent / fmv_CI))table_fmv <- comm_ind_pins %>%filter(land_use %in%c("Industrial", "Commercial")) |>group_by(year, land_use) %>%summarize(fmv_incent =sum(ifelse(incent_prop =="Incentive", fmv, 0), na.rm=TRUE),fmv =sum(fmv, na.rm=TRUE), ) %>%mutate(pct_incent = (fmv_incent / fmv)) %>%arrange(year) %>%select(year, land_use, fmv_incent, pct_incent) |>pivot_wider(id_cols = year, names_from = land_use, values_from =c(fmv_incent, pct_incent)) %>%ungroup() |>select(-year)Table2_fmvgrowth_2011 <-cbind(commind_together_fmv, table_fmv) %>%select(Year = year, "C&I Incentive FMV"= fmv_incent, "Share of C&I"= pct_incent,"Commercial Incent. FMV"= fmv_incent_Commercial, "Share of Commercial"= pct_incent_Commercial,"Industrial Incent. FMV"= fmv_incent_Industrial, "Share of Industrial"= pct_incent_Industrial, "All C&I FMV"= fmv_CI) %>%mutate(Year =as.character(Year)) %>%mutate(across(contains("Share"), scales::percent, accuracy =0.01)) Table2_fmvgrowth_2011 |>flextable() %>%add_header_row(values =c(" ", "Commercial & Industrial", "Commercial", "Industrial","All C&I"), colwidths =c(1,2,2,2, 1)) |>align(align ="right", part ="body" ) |>align(align ="center", part ="header") |>align(j =1, align =c("left"), part ="all" )``````{r}#| label: fig-Report-Figure1#| fig-cap: "**Figure 1 in Incentive Report** Incentive FMV by Year, 2011-2022 (Aggregate Value)"Figure1_data <- comm_ind_pins %>%filter(land_use %in%c("Commercial", "Industrial")) %>%group_by(year, land_use) %>%summarize(fmv =sum(ifelse(incent_prop=="Incentive", fmv/1000000000, 0) ))Figure1_data %>%ggplot() +geom_col(aes(x=year, y = fmv, fill = land_use)) +scale_x_continuous(limits =c(min_year -1, max_year +1), breaks =c(min_year, 2015, 2020, max_year )) +alea_theme() +labs(y ="FMV ($ Billions)")+theme(legend.position ="bottom", legend.title =element_blank(), axis.title.x =element_blank()) +scale_fill_manual(values = cmap_colors)``````{r}#| label: fig-Report-AppendixFigure#| fig-cap: "**Appendix Item in Incentive Report** Increases in Incentive FMV by Year, 2011-2022 (Normalized to 2011 FMV)"#| Appendix_Figure_FMVGrowth_2011 <- comm_ind_pins %>%filter(incent_prop =="Incentive") %>%reframe(fmv,type_fmv =sum(fmv, na.rm=TRUE), .by =c(year,land_use) ) %>%reframe(land_use, type_fmv,fmv_incent =sum(fmv, na.rm=TRUE), .by=year) %>%distinct() %>%arrange(year) %>%group_by(land_use) %>%mutate(ratio_2011 = type_fmv/ type_fmv[year==2011],ratio_both_2011 = fmv_incent/fmv_incent[year==2011]) Appendix_Figure_FMVGrowth_2011 %>%ggplot() +geom_line(aes(x=year, y = ratio_2011, group = land_use, color = land_use), lwd=1) +geom_line(aes(x=year, y =ratio_both_2011),lty =2, lwd=1) +scale_x_continuous(limits =c(min_year, max_year), breaks =seq(min_year, max_year )) +alea_theme() +scale_y_continuous(name ="Percent of 2011 FMV", labels = scales::percent) +scale_color_manual(values = cmap_colors) +labs(x=element_blank(), color =element_blank(),caption ="Dashed line represents all properties with incentive classification." )```### PIN Counts```{r}commind_together <- comm_ind_pins %>%# left_join(class_dict |> select(class, land_use)) |># filter(land_use %in% c("Industrial", "Commercial")) |>group_by(year) %>%summarize(proptype_pincount =n(),n_incent =sum(ifelse(incent_prop =="Incentive", 1, 0)),n_nonincent =sum(ifelse(incent_prop =="Non-Incentive", 1, 0))) %>%mutate(pct_incent = n_incent / proptype_pincount)``````{r}#| label: fig-Report-AppendixFig1#| fig-cap: "**Appendix Figure 1 in Incentive Report** Incentive FMV by Year, 2011-2022 (Normalized to 2011 FMV)"#| column: marginAppendix_Figure1 <- comm_ind_pins %>%filter(land_use %in%c("Commercial", "Industrial")) %>%group_by(year, land_use) %>%summarize(PC =sum(incent_prop=="Incentive") )Appendix_Figure1 %>%ggplot() +geom_col(aes(x=year, y = PC, fill = land_use)) +scale_x_continuous(limits =c(min_year -1, max_year +1), breaks =c(min_year, 2015, 2020, max_year )) +alea_theme() +theme(legend.position ="bottom",legend.title =element_blank(),axis.title.x =element_blank() ) +scale_fill_manual(values = cmap_colors)``````{r}#| label: fig-Report-Appendix-PC2#| fig-cap: "**Appendix Figure 2 in Incentive Report** Incentive Pins by Year, 2011-2022 (Normalized to 2011 Pin Count)"Appendix_Figure2_PinCount <- comm_ind_pins %>%mutate(year =as.numeric(year) ) |>filter(incent_prop =="Incentive") %>%reframe(PC=n(), .by=c(year, land_use)) %>%distinct() %>%reframe(land_use, PC,both_PC =sum(PC), .by=year) %>%distinct() %>%arrange(year) %>%group_by(land_use) %>%mutate(ratio_2011 = PC/ PC[year==2011],ratio_both_2011 = both_PC/both_PC[year==2011]) Appendix_Figure2_PinCount %>%ggplot() +geom_line(aes(x=year, y = ratio_2011, group = land_use, color = land_use), lwd=1 ) +geom_line(aes(x=year, y =ratio_both_2011), lty =2, lwd =1) +alea_theme() +scale_x_continuous(limits =c(min_year -1, max_year +1), breaks =c(min_year, 2010, 2015, 2020, max_year)) +scale_y_continuous(name ="Percent of 2011 Pin Count", label = scales::percent) +scale_color_manual(values = cmap_colors)+labs(title ="Number of PINs, Indexed to 2011",x =NULL,caption ="Dashed line represents growth in the number of commercial and industrial PINs",color =NULL)``````{r}table <- comm_ind_pins %>%filter(land_use %in%c("Industrial", "Commercial")) |>group_by(year, land_use) %>%summarize(proptype_pincount =n(),n_incent =sum(ifelse(incent_prop =="Incentive", 1, 0)),n_nonincent =sum(ifelse(incent_prop =="Non-Incentive", 1, 0))) %>%mutate(pct_incent = n_incent / proptype_pincount) %>%arrange(year) %>%mutate(year =as.character(year)) %>%filter(!land_use %in%c("Exempt", "Other Residential", "Owner Occupied", "Rental") ) %>%select(year, land_use, n_incent, pct_incent) |>pivot_wider(id_cols = year, names_from = land_use, values_from =c(n_incent,pct_incent)) %>%ungroup() |>select(-year)cbind(commind_together, table) %>%select(Year = year, "C&I Incentive Parcels"= n_incent, "Share of C&I"= pct_incent,"Commercial Pin Count"= n_incent_Commercial, "Share of Commercial"= pct_incent_Commercial,"Industrial Pin Count"= n_incent_Industrial, "Share of Industrial"= pct_incent_Industrial,"C&I PIN Count"= proptype_pincount) %>%mutate(Year =as.character(Year)) |>mutate(across(contains("Share"), scales::percent, accuracy =0.01)) |>flextable() %>%add_header_row(values =c(" ", "Incent C&I", "Commercial", "Industrial","All C&I"), colwidths =c(1,2,2,2, 1)) |>align(align ="right", part ="body" ) |>align(align ="center", part ="header") |>align(j =1, align =c("left"), part ="all" )```### Change in Incentive Classification```{r}#| label: tbl-categorycountsforcomparison#| tbl-cap: "Number of PINs that gain or lose incentive classification each year."pins_per_year <- comm_ind_pins %>%group_by(year) %>%summarize("Gains Incent"=sum(gain_incent, na.rm=TRUE),"Loses Incent"=sum(lose_incent, na.rm=TRUE),"PINs with Incent. Class."=sum(incent_prop=="Incentive"),"PINs in Sample"=n(),"Became Exempt"=sum(became_exempt, na.rm=TRUE))pins_per_year``````{r}df_2011_class8change <- comm_ind_pins|>group_by(pin) |>mutate(class8years =sum(class_1dig ==8)) |>mutate(class8_change =case_when( class8years == year_count ~"Always Class 8", class8years ==0~"Never Class 8",TRUE~"Changes to C8") ) |>ungroup() |>group_by(year, class8_change) |>summarize(group_pin_count =n(),group_year_fmv =sum(fmv, na.rm=TRUE), ) |>ungroup() |>group_by( class8_change) %>%mutate(base_year_fmv = group_year_fmv[year ==min(year)],fmv_group_growth = (group_year_fmv / base_year_fmv) -1) # df_2011_class8change %>% # filter(year == 2022) %>%# select(class8_change, fmv_group_growth, base_year_fmv, group_year_fmv, everything(), -year)df_2011_class8change %>%filter(year ==2022) %>%select(class8_change, fmv_group_growth, base_year_fmv, group_year_fmv, everything(), -year)``````{r}#| label: tbl-class8eachyear-2011to2022#| tbl-cap: "Number of PINs that became each major class type each year."comm_ind_pins <- comm_ind_pins %>%group_by(pin) |>mutate(year =as.character(year), class8years =sum(class_1dig ==8),class8_change =case_when( class8years == year_count ~"Always Class 8", class8years ==0~"Never Class 8",sum(lag(class_1dig) !=8& class_1dig ==8) >0~"Becomes Class 8",sum(class_1dig !=8&lag(class_1dig) ==8 ) >0~"Leaves Class 8",TRUE~"Other"),becomes8 =ifelse(lag(class_1dig) !=8& class_1dig ==8, 1, 0),becomes7 =ifelse(lag(class_1dig) !=7& class_1dig ==7, 1, 0),becomes6 =ifelse(lag(class_1dig) !=6& class_1dig ==6, 1, 0),switches_to8 =ifelse( (lag(class_1dig) ==7|lag(class_1dig) ==6 )& becomes8 ==1, 1, 0), ) %>%ungroup() Appendix_Table_Class8PINs_2011 <- comm_ind_pins |>group_by(year) %>%summarize("Becomes 8"=sum(becomes8==1, na.rm=TRUE),"Total 8"=sum(class_1dig ==8),"6 or 7 to 8"=sum(switches_to8 ==1, na.rm=TRUE),"Becomes 7"=sum(becomes7 ==1, na.rm=TRUE),"Total 7"=sum(class_1dig ==7),"Becomes 6"=sum(becomes6 ==1, na.rm=TRUE),"Total 6"=sum(class_1dig ==6),"PINs with Incent. Class."=sum(incent_prop=="Incentive"),"PINs in Sample"=n(), )Appendix_Table_Class8PINs_2011 %>% flextable::flextable()``````{r}#| label: tbl-construction-onvacant2011to2022#| tbl-cap: "Development on vacant parcels with and without incentive classes."comm_ind_pins <- comm_ind_pins %>%group_by(pin) |>mutate(new_dev =ifelse(lag(class_1dig) ==1&!class_1dig %in%c(0, 1), 1, 0),new_dev_w_incent =ifelse(lag(class_1dig) ==1&!class_1dig %in%c(0, 1) & incent ==1, 1, 0), became_exempt =ifelse(class_1dig ==0&lag(class_1dig)!=0, 1, 0),became_taxed =ifelse(class_1dig !=0&lag(class_1dig)==0, 1, 0), ) %>%ungroup() Table_newconstruction <- comm_ind_pins |>group_by(year) %>%summarize("New Construction"=sum(new_dev ==1, na.rm = T),"New Construction w/ Incentive"=sum(new_dev_w_incent ==1, na.rm = T), "Gained Incentive"=sum(gain_incent ==1, na.rm = T), "Incentive Ends"=sum(lose_incent ==1, na.rm = T),"Becomes 8"=sum(becomes8==1, na.rm=TRUE),"PINs with Incent. Class."=sum(incent_prop=="Incentive"),"PINs in Sample"=n(),"Became Exempt"=sum(became_exempt, na.rm=TRUE), "Became Taxed"=sum(became_taxed, na.rm=TRUE) )Table_newconstruction %>% flextable::flextable()```### Commercial and Industrial Growth```{r}#| label: tbl-incentchange-2022indexed#| tbl-cap: "Aggregate FMV Growth by Incentive Classification. `Changes Sometime` includes properties that gained or lost an incentive classification. `incent_status` in tables below breaks up Changes Sometime into more detailed categories."df_2011_incentchange <- comm_ind_pins|>group_by(year, incent_change) |>summarize(group_pin_count =n(),group_year_fmv =sum(fmv, na.rm=TRUE), ) |>ungroup() |>group_by( incent_change) %>%mutate(base_year_fmv = group_year_fmv[year ==min(year)],fmv_group_growth = (group_year_fmv / base_year_fmv) -1) df_2011_incentchange %>%#filter(year == params$year) %>%filter(year == max_year) |>select("Gains/Loses Incentive Classification"= incent_change, "FMV Growth"= fmv_group_growth, "2011 FMV\n(Billions)"= base_year_fmv, "Aggregate FMV\n(Billions)"= group_year_fmv, "PIN Count"= group_pin_count, -year) |>mutate(across(contains("Growth"), scales::percent, accuracy =0.01)) |>mutate(across(2:3, ~round((./1000000000), digits =3)) )|>flextable() %>%align(align ="right", part ="body" ) |>align(align ="center", part ="header") |>align(j =1, align =c("left"), part ="all" )``````{r}#| label: tbl-growthcalculations-byincentstatus#| tbl-cap: "Aggregate FMV Growth by `incent_status`. Calculations for PINs counts in header of table in report."comm_ind_pins %>%ungroup() %>%group_by(year, incent_status) |>summarize(group_pin_count =n(),group_year_fmv =sum(fmv, na.rm=TRUE)) |>ungroup() |>group_by(incent_status) %>%mutate(base_year_fmv = group_year_fmv[year ==min(year)],fmv_group_growth = (group_year_fmv / base_year_fmv) -1) |>filter(year == params$year) %>%select("Incentive Status"= incent_status, "FMV Growth"= fmv_group_growth, "2011 FMV\n(Billions)"= base_year_fmv, "Aggregate FMV\n(Billions)"= group_year_fmv, "PIN Count"= group_pin_count, -year) |>mutate(across(contains("Growth"), scales::percent, accuracy =0.01)) |>mutate(across(2:3, ~round((./1000000000), digits =3)) )|>flextable() %>%align(align ="right", part ="body" ) |>align(align ="center", part ="header") |>align(j =1, align =c("left"), part ="all" )``````{r}#| label: tbl-growthcalculations-bylandusechange#| tbl-cap: !expr paste0("Aggregate FMV Growth from 2011 to ", params$year, " by `landuse_change`." )comm_ind_pins %>%group_by(year, landuse_change) |>summarize(group_pin_count =n(),group_year_fmv =sum(fmv, na.rm=TRUE)) |>ungroup() |>group_by(landuse_change) %>%mutate(base_year_fmv = group_year_fmv[year ==min(year)],base_year_n = group_pin_count[year ==min(year)],n_group_growth = group_pin_count/base_year_n -1,fmv_group_growth = (group_year_fmv / base_year_fmv) -1) %>%filter(year == params$year) %>%select("Changes Land Use"= landuse_change, "FMV Growth"= fmv_group_growth, "2011 FMV\n(Billions)"= base_year_fmv, "Aggregate FMV\n(Billions)"= group_year_fmv, "PIN Count"= group_pin_count, -year) |>mutate(across(contains("Growth"), scales::percent, accuracy =0.01)) |>mutate(across(2:3, ~round((./1000000000), digits =3)) )|>flextable() %>%align(align ="right", part ="body" ) |>align(align ="center", part ="header") |>align(j =1, align =c("left"), part ="all" )``````{r create-df-2011-bal-20112022}df_2011_bal <- comm_ind_pins %>% group_by(year, landuse_change, incent_status) |> summarize( group_pin_count = n(), group_year_fmv = sum(fmv, na.rm=TRUE)) |> ungroup() |> group_by(landuse_change, incent_status) %>% mutate( base_year_fmv = group_year_fmv[year == min(year)], base_year_n = group_pin_count[year == min(year)], n_group_growth = group_pin_count/base_year_n -1, fmv_group_growth = (group_year_fmv / base_year_fmv) -1) |> mutate(year = as.numeric(year))``````{r}#| label: tbl-growthcalculations-landusechange-incentstatus-balanced#| tbl-cap: !expr paste0("Growth from 2011 to ", params$year, " - Change in Land Use by Incentive Class Status. Non-winsorized version of table.")df_2011_bal %>%select(year, landuse_change, incent_status, fmv_group_growth, group_pin_count) %>%filter(year == params$year) %>%select("Changes Land Use"= landuse_change,"Incentive Status"= incent_status,"FMV Growth"= fmv_group_growth, "PIN Count"= group_pin_count, -year) |>mutate(across(contains("Growth"), scales::percent, accuracy =0.01)) |> DT::datatable(rownames =FALSE, options =list(dom ='tp'))``````{r}#| label: fig-landusebyincentstatus#| fig-cap: "Includes the 'Excluded' Category"#| column: margindf_2011_bal %>%ggplot() +geom_line(aes(x=year, fmv_group_growth, group = incent_status, color = incent_status), lwd=1) +labs( title ="FMV Growth Since 2011 by Land Use & Incentive Status", x =element_blank(),y ="FMV Growth since 2011", color =element_blank()) +theme_bw() +scale_color_manual(values = cmap_colors) +theme( panel.background = ggplot2::element_blank(),panel.grid.minor.x = ggplot2::element_blank(),panel.grid.major.x = ggplot2::element_blank(),panel.grid.major.y =element_line(color ="grey"),panel.grid.minor.y =element_line(color ="grey", linetype ="dashed"),axis.ticks =element_line(color ="gray"),axis.ticks.x =element_blank(),legend.position ="bottom") +facet_wrap(~landuse_change)+scale_x_continuous(limits =c(2010, 2024), breaks =c(2011, 2017, 2023)) ``````{r}#| label: fig-landusebyincentstatus-clean#| fig-cap: "Excludes the 'Excluded' Category and 'Exempt Sometime' properties."df_2011_bal %>%filter(incent_status !="Excluded"& landuse_change !="Excluded"& landuse_change !="Exempt Sometime") %>%ggplot() +geom_line(aes(x=year, fmv_group_growth, group = incent_status, color = incent_status),lwd=1) +labs( title ="FMV Growth Since 2011 by Land Use", caption ="PINs that did not exist during all years of the sample frame were excluded from the image (n=10,809).",x =element_blank(),y ="FMV Growth since 2011" ) +scale_color_manual(values = cmap_colors) +theme_bw() +scale_y_continuous(labels = scales::percent) +scale_x_continuous(limits =c(min_year -1, max_year +1), breaks =c(min_year, max_year)) +theme( panel.background = ggplot2::element_blank(),panel.grid.minor.x = ggplot2::element_blank(),panel.grid.major.x = ggplot2::element_blank(),panel.grid.major.y =element_line(color ="grey"),panel.grid.minor.y =element_line(color ="grey", linetype ="dashed"),axis.ticks =element_line(color ="gray"),axis.ticks.x =element_blank(),legend.position ="bottom", legend.title =element_blank()) +facet_wrap(~landuse_change)``````{r}#| label: fig-growth-facetby-incentstatus#| fig-cap: !expr paste0("Growth from 2011 to ", params$year, ". Faceted by if a PIN changed landuse during the sample period. Indexed to fair market value during 2011. For comparison only.")#| column: marginTable9_data <- df_2011_bal %>%mutate(year =as.factor(year)) |>select(year, fmv_group_growth, landuse_change) Table9_data %>%ggplot() +geom_line(aes(x=year, y=fmv_group_growth, group = landuse_change, color = landuse_change), lwd=1) +theme_bw() +facet_wrap(~incent_status, nrow =1) +scale_x_discrete(breaks =c(2012, params$year)) +scale_y_continuous(labels = scales::percent) +scale_color_manual(values = cmap_colors) +labs(title=paste0("Growth from 2011 to ", params$year),subtitle ="Incentive Classification Status by Land Use Change",y ="FMV Growth since 2011", x =NULL,caption ="Values are indexed to 2011 FMV") +theme( panel.background = ggplot2::element_blank(),panel.grid.minor.x = ggplot2::element_blank(),panel.grid.major.x = ggplot2::element_blank(),panel.grid.major.y =element_line(color ="grey"),panel.grid.minor.y =element_line(color ="grey", linetype ="dashed"),axis.ticks =element_line(color ="gray"),axis.ticks.x =element_blank(),legend.position ="bottom",legend.title =element_blank())``````{r}#| label: fig-Report-Figure10#| fig-cap: !expr paste0(" **Figure 10 in Incentive Report** Aggregate FMV Growth from 2011 to ", params$year, ". Faceted by PIN incentive status during the sample period. Indexed to fair market value during 2011.")Figure10_data <- df_2011_bal %>%filter(landuse_change !="Excluded"& incent_status !="Excluded"& landuse_change !="Exempt Sometime") %>%mutate(year =as.numeric(year)) %>%select(year, incent_status, landuse_change, fmv_group_growth)Figure10_data |>ggplot() +geom_line(aes(x=year, y=fmv_group_growth, group = landuse_change, color =fct_reorder2(landuse_change, year, fmv_group_growth)), lwd=1) +theme_bw() +facet_wrap(~incent_status, nrow =1) +scale_x_continuous(limits =c(min_year-1, max_year+1), breaks =c(min_year, max_year)) +labs(title="Growth from 2011", subtitle ="Incentive Classification Status by Land Use Change",y ="FMV Growth since 2011", x =NULL,caption =paste0("Values are indexed to 2011 FMV. \nExcludes PINs that were tax exempt some years \nor did not exist for all years between 2011 and ", params$year)) +theme( panel.background = ggplot2::element_blank(),panel.grid.minor.x = ggplot2::element_blank(),panel.grid.major.x = ggplot2::element_blank(),panel.grid.major.y =element_line(color ="grey"),panel.grid.minor.y =element_line(color ="grey", linetype ="dashed"),axis.ticks =element_line(color ="gray"),axis.ticks.x =element_blank(),legend.position ="bottom", legend.title =element_blank()) +scale_color_manual(values = cmap_colors) +scale_y_continuous(labels = scales::percent) ```### FMV Growth by Property Type - All Property Types```{r}#| label: fig-Report-Figure2#| fig-cap: "**Figure 2 from Incentive Report**"#| cook_mc <-read_csv("../Output/ptaxsim_muni_MC_2006to2023_new.csv") |>filter(muni_mc_year >= min_year & muni_mc_year <= max_year)Figure2_data <- cook_mc |>rename_with(~str_remove(.,"muni_mc_")) |>mutate(across(is.numeric, round)) |>mutate(group =case_when( major_class_code =="2"~"Single-Family", major_class_code %in%c("3", "9") ~"Multi-Family", major_class_code %in%c("5A", "5B", "6A", "6B", "7A", "7B", "8") ~"C&I", T ~"Other Type" )) |>group_by(year, group) |>summarize(type_fmv =sum(fmv)/1000000000) |># In Billionsungroup() |>group_by(group) |>filter(group !="Other Type") |>mutate(ratio_2011 = type_fmv/ type_fmv[year==2011] ) Figure2_data %>%ggplot()+geom_line(aes(x=year, y = type_fmv, color =fct_reorder2(group, year, ratio_2011)), lwd=1) +alea_theme() +labs(x=element_blank(),y="FMV (Billions)",color =element_blank()) +scale_x_continuous(limits =c(min_year-1, max_year+1), breaks =c(min_year, 2016, max_year)) +scale_color_manual(values = cmap_colors) +theme(legend.position ="bottom")``````{r}#| label: fig-Report-Figure3#| fig-cap: "**Figure 3 from Incentive Report**"Figure3_data <- cook_mc |>rename_with(~str_remove(.,"muni_mc_")) |>mutate(across(is.numeric, round)) |>mutate(group =case_when( major_class_code =="2"~"Single-Family", major_class_code %in%c("3", "9") ~"Multi-Family", major_class_code %in%c("5A") ~"Commercial", major_class_code %in%c("5B") ~"Industrial", major_class_code %in%c("6A", "6B") ~"Industrial Incentive", major_class_code %in%c("7A", "7B") ~"Commercial Incentive", major_class_code =="8"~"Class 8", T ~"Other Type" )) |>group_by(year, group) |>summarize(type_fmv =sum(fmv)/1000000000) |># In Billionsungroup() |>group_by(group) |>filter(group !="Other Type") |>mutate(ratio_2011 = type_fmv/ type_fmv[year==2011] ) Figure3_data %>%ggplot()+geom_line(aes(x=year, y = ratio_2011, color =fct_reorder2(group, year, ratio_2011)), lwd=1) +alea_theme() +labs(x=element_blank(),y="% of 2011 FMV",color =element_blank()) +scale_y_continuous(label = scales::percent) +scale_x_continuous(limits =c(min_year-1, max_year+1), breaks =c(min_year, 2016, max_year)) +scale_color_manual(values = cmap_colors) +theme(legend.position ="right")``````{r}#| label: tbl-class8eachyearsouthtriad#| tbl-cap: "Number of PINs that became each major class 8 in the South triad."#| eval: false#| include: false#| #| # comm_ind_pins %>% # filter(class8_change == "Becomes Class 8") %>% # left_join(bor, by = c("pin", "year" = "tax_year")) %>%# filter(!is.na(appellant)) %>%# # arrange(pin, desc(year)) %>%# select(year, appellant, project_id, class.x, everything())# example of PIN that was class 8 and then became un-incentivized in 2017# comm_ind_pins %>% filter(pin == "16271000330000")comm_ind_pins %>%filter(class8_change =="Becomes Class 8"& Triad =="South") %>%arrange(pin) %>%select(year, class, everything())``````{r}#| label: tbl-southtriadpins#| tbl-cap: "South Triad Number of PINs that became each major class type each year."#| layout-ncol: 3#| eval: false#| include: falsecomm_ind_pins %>%filter(becomes8 ==1& Triad =="South") %>%arrange(pin) %>%select(year, class, everything())comm_ind_pins %>%filter(becomes7==1& Triad =="South") %>%arrange(pin) %>%select(year, class, everything())comm_ind_pins %>%filter(becomes6 ==1& Triad =="South") %>%arrange(pin) %>%select(year, class, everything())```## Export Tables```{r}library(readxl)tablelist <-list(# table 1 - from cmap"Table 2"= Table2_allyears,# Table 3 from individual year quarto files# Table 4 from individual year quarto files# Table 5 from individual year quarto files# Table 6 from individual year quarto files# Table 7 from individual year quarto files# Table 8 from individual year quarto files"Table 9"= Table9_data, # goes with Figure 10. FMV growth indexed by incent status and land use"Table 10"= Table_newconstruction, "AppIV Table 1"= Appendix_PinCount_allyears,"AppIV Table 2"= Appendix_Table_Class8PINs, # Was table 6 in old versions of document."Figure 1 Data"= Figure1_allyears,"Figure 1 2011-2022"= Figure1_data, # only 2022 to 2022 "Figure 2 Data"= Figure2_data, # Line Chart - FMV for single and multi family vs C&I FMV"Figure 3 Data"= Figure3_data, # Line Chart - Increase in FMV indexed to 2011 for Select property types# Figure 4 from individual year quarto files# Figure 5A and 5B from individual year quarto files# Figure 6-8 by cmap# "Figure 9 Data" = Figure9_data, # dot plots from individual year quarto files"Figure 10 Data"= Figure10_data, # FMV growth indexed by incent status and land use"Appendix Figure X"= Appendix_Figure2_PinCount,"Appendix Figure X+1"= Appendix_PinCount_growth_allyears,"Appendix Figure X+2"= Appendix_Figure_FMVgrowth_allyears# "Muni Stats" = munilevel,# "Muni Rate Change" = muni_ratechange,# # "Cook Sums" = table_cook,# "Cook Major Class Sums" = cty_MC_table,# "Cook Rate Change" = cook_ratechange)writexl::write_xlsx(tablelist, "../Output/calculations_report_content_2025_03_27.xlsx")# readme <- c(# "Pin Change: Count of PINs gaining or losing an incentive class each year.",# "Major Class Change: Counts of PINs becoming major class types each year.",# # "IndustShare_all is same as Indust_share but includes all munis.",# "CommercShare_all is same as Commerc_share but includes all munis.") %>% as.data.frame()# # paper_tables <- list(# "README"= readme,# # "Pin Change per Year" = pins_per_year,# # # )# writexl::write_xlsx(paper_tables, "../Output/incentive_report_tables.xlsx")beepr::beep(sound ="mario")```