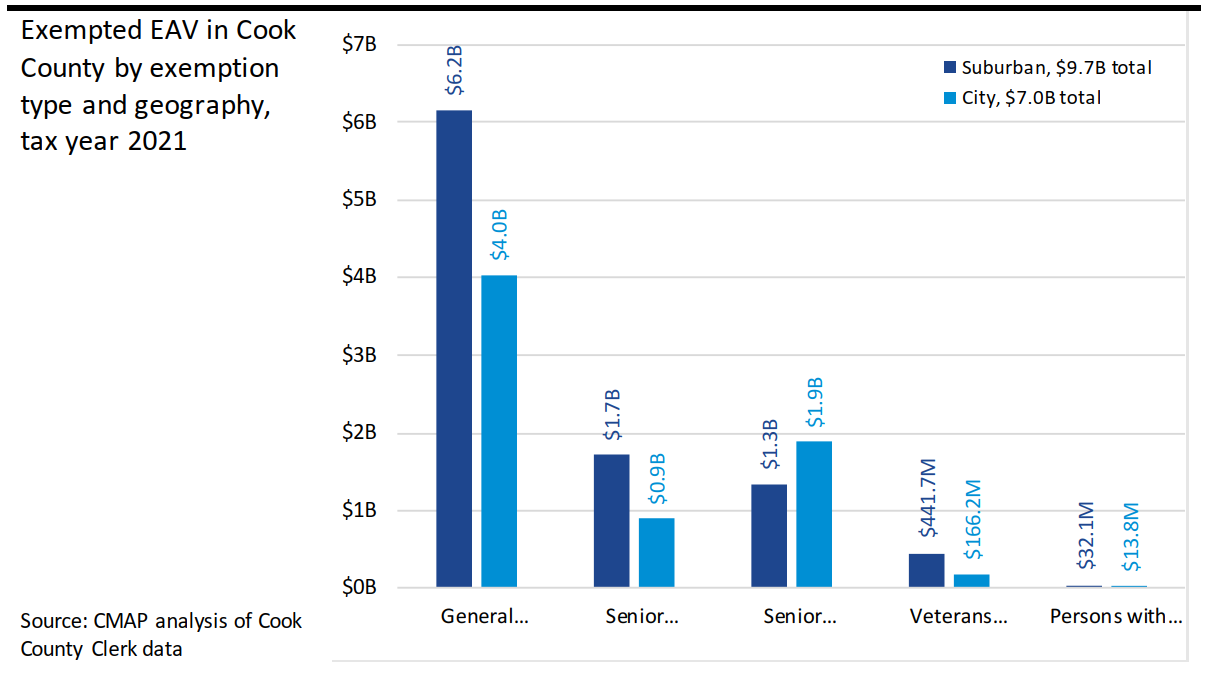
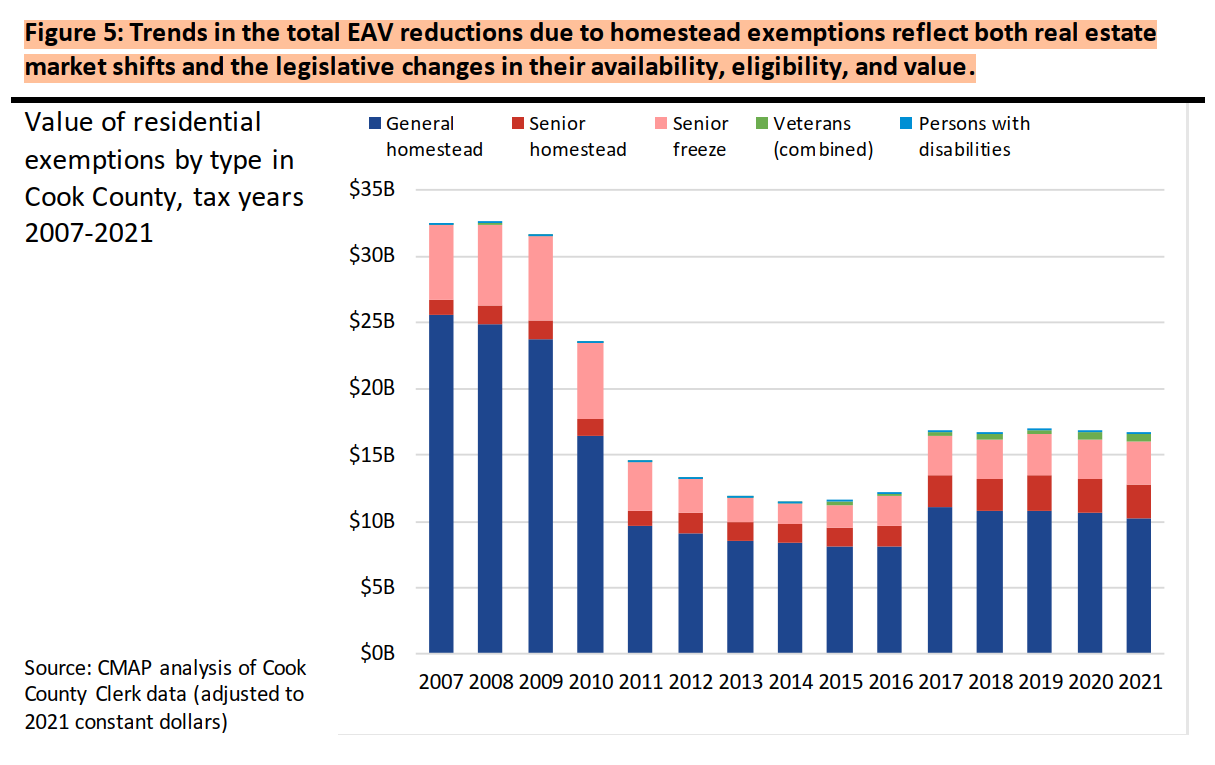
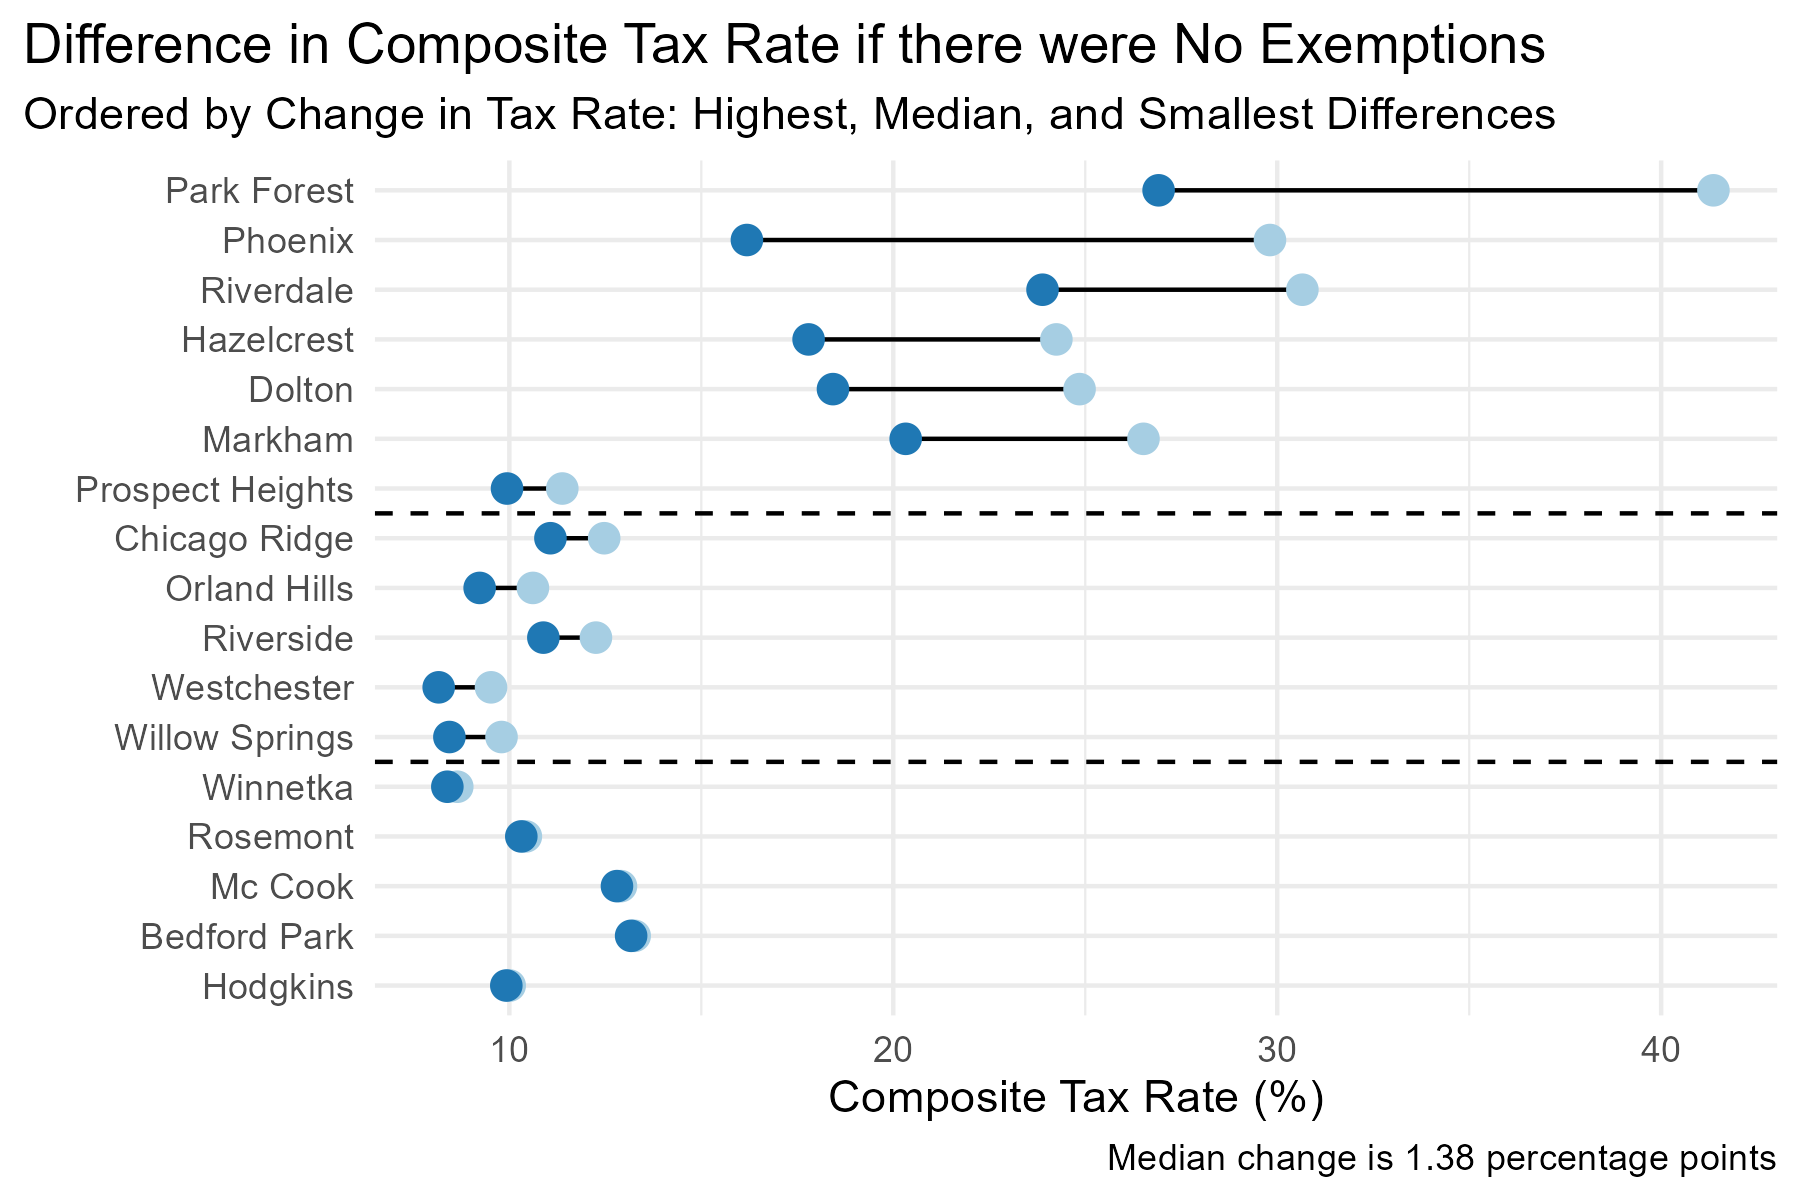
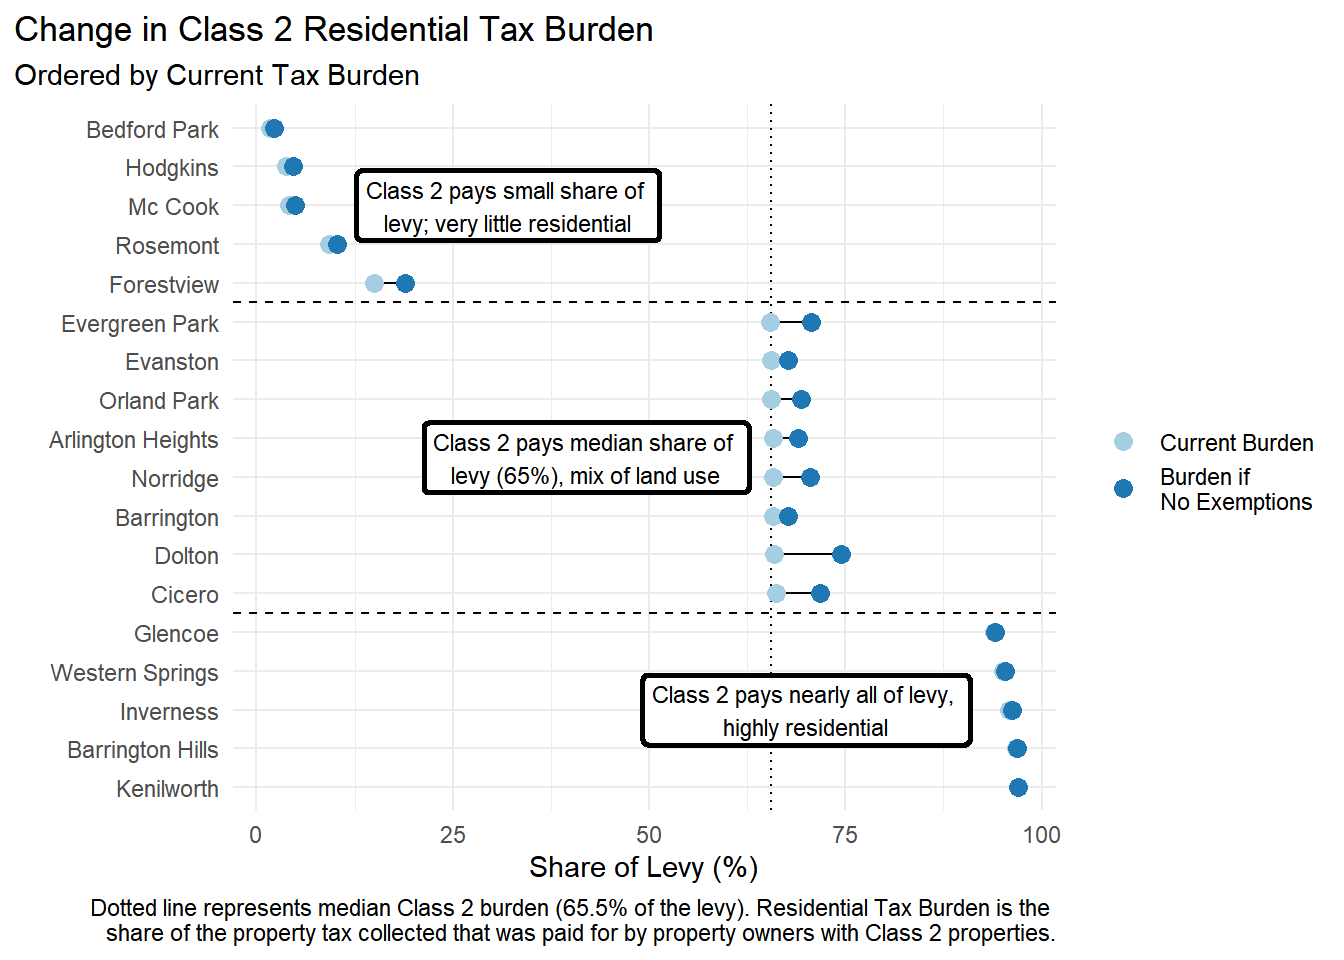
--- title: "The Use and Effects of Homestead Exemptions in Cook County" --- ```{r setup, warning=FALSE, message=FALSE} #| code-fold: TRUE library(tidyverse) library(ptaxsim) library(DBI) library(httr) library(jsonlite) library(glue) library(sf) library(DT) knitr::opts_chunk$set(warning = FALSE, message = FALSE) muni_shp <- read_sf("https://gis.cookcountyil.gov/traditional/rest/services/politicalBoundary/MapServer/2/query?outFields=*&where=1%3D1&f=geojson") nicknames <- readxl::read_excel("../Necessary_Files/muni_shortnames.xlsx") ``` ## Cook County's Use of Homestead Exemptions ### Figure 1 or 2?. Exemption Use ```{r} <- read_csv ("../Output/ptaxsim_muni_level_2006-2022.csv" ) |> left_join (nicknames)<- read_csv ("../Output/ptaxsim_muni_class_summaries_2006-2022.csv" ) |> left_join (nicknames)``` ```{r} #| layout-ncol: 4 <- c (2020 , 2021 , 2022 , 2023 )for (i in year_examples){<- muni_cl_sums |> filter (year == i) |> group_by (year) |> summarize (AV = sum (muni_c_av), EAV = sum (muni_c_eav), Eq_AV = sum (muni_c_equalized_av),'Taxed EAV' = sum (muni_c_current_taxable_eav),'All Exemptions' = sum (muni_c_all_exemptions), 'GHE' = sum (muni_c_exe_homeowner), 'Senior Exemp.' = sum (muni_c_exe_senior), 'Freeze Exemp.' = sum (muni_c_exe_freeze), 'PINs in Muni' = sum (muni_c_pins_in_muni),'PINs with Exemptions' = sum (muni_c_has_HO_exemp)) |> pivot_longer (cols = c (AV: 'PINs with Exemptions' ), names_to = "Totals" , values_to = "Values" ) print (tbl)``` ### Figure 3. Percent Exempt ```{r} <- c (2020 , 2021 , 2022 )for (i in year_examples){<- muni_sums |> filter (year== i)|> mutate (pct_fmv_exempt = muni_fmv_exempt / muni_fmv ) |> select (pct_fmv_exempt)print (muni_sums |> filter (year== i)|> mutate (pct_fmv_exempt = muni_fmv_exempt / muni_fmv ) |> mutate (agency_name = ifelse (agency_name == "TOWN CICERO" , "CITY OF CICERO" , agency_name) ) |> full_join (muni_shp, by = c ("agency_name" = "AGENCY_DESC" )) |> ggplot (aes (fill = pct_fmv_exempt)) + geom_sf (aes (geometry = geometry), color = "black" ) + theme_void ()+ labs (title = paste0 (i), subtitle = "Exempt FMV / Municipality FMV" ) + theme_void () + theme (axis.ticks = element_blank (), axis.text = element_blank ())+ scale_fill_steps2 (high = "darkblue" , low = "black" , mid = "beige" ,n.breaks = 7 , show.limits= TRUE ,na.value = NA ,nice.breaks = FALSE ,midpoint = median (median_exempt$ pct_fmv_exempt),name = "% FMV \n that is exempt" , label = scales:: percent))``` ### Figure 4. Exempt Tax Base in Cook County  ### Figure 5. Value of residential exemptions by type in Cook County, 2006 - 2023  ## Effect on Composite Tax Rates ```{r} #| label: tbl-updated-code-taxrates #| tbl-cap: "Table 1: Actual and Hypothetical Composite Tax Rates if GHE $0 in select Years" #| results: asis <- read_csv ("../Output/ptaxsim_muni_level_2006-2022.csv" ) |> left_join (nicknames)<- muni_sums |> select (year, clean_name, muni_current_rate_avg)<- left_join (muni_cl_sums, muni_comp_rates, by = c ("year" , "clean_name" ))<- c (2020 , 2021 , 2022 , 2023 )for (i in year_examples){<- muni_cl_sums |> filter (year == i) |> group_by (clean_name) |> summarize (muni_current_rate_avg = first (muni_current_rate_avg),muni_levy = sum (muni_c_final_tax_to_dist),muni_current_taxable_eav = sum (muni_c_current_taxable_eav),muni_exe_homeowner = sum (muni_c_exe_homeowner)) |> mutate ( new_comp_muni_rate = muni_levy/ (muni_current_taxable_eav + muni_exe_homeowner),new_comp_muni_rate = new_comp_muni_rate, cur_comp_muni_rate = muni_current_rate_avg / 100 ,rate_change = cur_comp_muni_rate - new_comp_muni_rate) |> select (clean_name, rate_change, cur_comp_muni_rate, new_comp_muni_rate, muni_levy) |> arrange (desc (rate_change)) |> datatable (rownames = FALSE ,colnames = c ('Municipality' = 'clean_name' , 'Composite Tax Rate Change' = 'rate_change' , 'Current Comp. Rate' = 'cur_comp_muni_rate' , 'Hypothetical Rate' = 'new_comp_muni_rate' , 'Composite Levy' = 'muni_levy' )|> formatPercentage (c ('Current Comp. Rate' , 'Hypothetical Rate' , 'Composite Tax Rate Change' digits = 2 ) |> formatCurrency ('Composite Levy' , digits = 0 ) print (htmltools:: tagList (tbl)) # # # MuniLevel_CompRates <- muni_sums |> # filter(year == 2021) |> # select(clean_name, cur_comp_muni_rate, new_comp_muni_rate, tif_share, zero_bills, final_tax_to_dist) |> # mutate(cur_comp_muni_rate = cur_comp_muni_rate/100, # new_comp_muni_rate = new_comp_muni_rate / 100 , # rate_change = cur_comp_muni_rate - new_comp_muni_rate) |> # select(clean_name, rate_change, cur_comp_muni_rate, new_comp_muni_rate, final_tax_to_dist) |> arrange(desc(rate_change)) # # datatable(MuniLevel_CompRates, rownames = FALSE, # colnames = c('Municipality' = 'clean_name', # 'Composite Tax Rate Change'='rate_change', # 'Current Comp. Rate' = 'cur_comp_muni_rate', # 'Hypothetical Rate' = 'new_comp_muni_rate', # #'%Rev to TIF' = 'tif_share', 'Count of $0 Tax Bills' = 'zero_bills', # 'Composite Levy' = 'final_tax_to_dist'), # caption = "Table 1: 2021 Current and Hypothetical Composite Tax Rates if GHE $0") |> # formatPercentage(c('Current Comp. Rate', 'Hypothetical Rate', # # '%Rev to TIF' # 'Composite Tax Rate Change' # ), # digits = 2) |> # formatCurrency('Composite Levy', digits = 0) ``` ### Figure 6. Composite property tax rates with and without homestead exemptions, tax year 2021 ### Table 1. Change in composite property tax rates due to exemptions, tax year 2021. ```{r} #| code-fold: true <- read_csv ("../Output/ptaxsim_muni_level_2006-2021.csv" ) |> filter (year == 2021 ) |> left_join (nicknames)``` ```{r} <- muni_sums |> select (clean_name, cur_comp_muni_rate, new_comp_muni_rate, tif_share, zero_bills, final_tax_to_dist) |> mutate (current_rate_avg = cur_comp_muni_rate/ 100 ,new_comp_muni_rate = new_comp_muni_rate / 100 ,rate_change = current_rate_avg - new_comp_muni_rate) |> select (clean_name, rate_change, current_rate_avg, new_comp_muni_rate, final_tax_to_dist) |> arrange (desc (rate_change))datatable (MuniLevel_CompRates, rownames = FALSE ,colnames = c ('Municipality' = 'clean_name' , 'Composite Tax Rate Change' = 'rate_change' , 'Current Comp. Rate' = 'current_rate_avg' , 'Hypothetical Rate' = 'new_comp_muni_rate' , #'%Rev to TIF' = 'tif_share', 'Count of $0 Tax Bills' = 'zero_bills', 'Composite Levy' = 'final_tax_to_dist' ),caption = "Table 1: Current and Hypothetical Composite Tax Rates if GHE $0" ) |> formatPercentage (c ('Current Comp. Rate' , 'Hypothetical Rate' , # '%Rev to TIF' 'Composite Tax Rate Change' digits = 2 ) |> formatCurrency ('Composite Levy' , digits = 0 )``` ### Figure 7. Map of Spatial Patterns in Composite Tax Rate Change ### Figure 7 Alternate. Composite Tax Rates for Municipalities  ## Effect on Tax Burdens ### Figure 8. Dolton example of Share of levy paid by property type ```{r} <- read_csv ("../Output/ptaxsim_muni_MC_2006-2021.csv" ) |> # rename_all(~str_replace_all(., "muni_mc_","")) |> filter (year == 2021 ) |> left_join (nicknames)<- MC_sums |> mutate (hyp_taxable_eav = current_taxable_eav + exe_homeowner,class_taxes_current = current_taxable_eav * (cur_comp_muni_rate/ 100 )|> group_by (clean_name) |> mutate (muni_eav = sum (eav),muni_levy = sum (final_tax_to_dist),hyp_muni_taxableEAV = sum (new_taxable_eav)|> ungroup () |> mutate (new_comp_rate = muni_levy / hyp_muni_taxableEAV,class_taxes_hyp = hyp_taxable_eav * (new_comp_rate),pct_eav = eav / muni_eav,# pct_taxburden_current = total_bill_current / muni_levy, # pct_taxburden_ghe0 = new_taxable_eav / muni_levy, pct_taxburden_current = class_taxes_current / muni_levy,pct_taxburden_ghe0 = class_taxes_hyp / muni_levy,burden_shift = (pct_taxburden_current - pct_taxburden_ghe0)* 100 )<- MC_burden |> filter (major_class_code == 2 ) |> select (clean_name, pct_eav, burden_shift, pct_taxburden_current, pct_taxburden_ghe0) |> arrange (pct_eav)|> filter (clean_name == "Dolton" ) |> select (major_class_code, pct_taxburden_current, pct_taxburden_ghe0) |> arrange (desc (pct_taxburden_current))``` ### Table 3. ### Table 4. ### Figure 10. Tax Burden Shift from Current GHE  ### Table 2. Change in share of property tax burden ```{r} #| code-fold: true datatable (current_burden_c2, rownames = FALSE ,colnames = c ('Municipality' = 'clean_name' , 'Burden Shift, Pct Pt Change' = 'burden_shift' , "C2 EAV/Muni EAV" = 'pct_eav' , 'Current Tax Burden \n C2 Tax Collected / Muni Levy' = 'pct_taxburden_current' , "Hypothetical Tax Burden \n Hyp. C2 Tax Collected / Muni Levy" = 'pct_taxburden_ghe0' ),caption = "Table 2: Current Share of Taxable EAV and Share of Levy Paid by Class 2 Properties" |> formatPercentage (c (2 ,4 ,5 ), digits = 2 ) |> formatRound (c (3 ), digits = 2 )``` #### Figure 10 Follow up. Current Tax Burden Map ```{r} #| code-fold: true |> # mutate(burden_current = ifelse(burden_current>1, 1, burden_current)) |> filter (major_class_code == 2 ) |> mutate (agency_name = ifelse (agency_name == "TOWN CICERO" , "CITY OF CICERO" , agency_name) ) |> full_join (muni_shp, by = c ("agency_name" = "AGENCY_DESC" )) |> ggplot (aes (fill = pct_taxburden_current)) + geom_sf (aes (geometry = geometry), color = "black" ) + theme_void () + theme (axis.ticks = element_blank (), axis.text = element_blank ())+ # scale_fill_gradientn( scale_fill_stepsn (colors = c ("#ffffcc" ,"#a1dab4" ,"#41b6c4" ,"#2c7fb8" , "#253494" ),show.limits= TRUE , limits = c (0 ,1 ),na.value = "gray70" ,n.breaks = 6 ,name = "Burden with \n Exemptions" , labels = scales:: percent+ labs (title = "Current share of property tax burden" , subtitle = "for Class = 2 Property Types" )``` ### Figure 11. Zero Dollar Bills 


