Code
source("scripts/descriptive_stats_22_lags_cluster_AWM_v7_4_1.R")
quarto::quarto_render("levy_paper_tables_v7_4.qmd")source("scripts/descriptive_stats_22_lags_cluster_AWM_v7_4_1.R")
quarto::quarto_render("levy_paper_tables_v7_4.qmd")include_table("v22_table_01_distribution.html")| agency | variable | N | p5 | p25 | p50 | p75 | p95 |
|---|---|---|---|---|---|---|---|
| Muni | d_levy | 1572 | -1.3 | 0.9 | 2.6 | 4.6 | 11.8 |
| Muni | d_eav | 1575 | -15.5 | -6.9 | -1.5 | 4.2 | 24.1 |
| Other | d_levy | 2145 | -4.6 | 1.1 | 2.3 | 3.4 | 8.3 |
| Other | d_eav | 2145 | -16.3 | -7.2 | -1.6 | 4.1 | 24.1 |
| School | d_levy | 1995 | -2.7 | 1.4 | 2.3 | 3.5 | 8.6 |
| School | d_eav | 1995 | -14.8 | -7.1 | -1.6 | 4.1 | 23.3 |
| Township | d_levy | 420 | -2.0 | 1.2 | 2.7 | 4.1 | 6.8 |
| Township | d_eav | 420 | -14.1 | -6.8 | -1.4 | 3.9 | 21.6 |
| All | d_levy | 6132 | -2.9 | 1.1 | 2.4 | 3.8 | 9.2 |
| All | d_eav | 6135 | -15.4 | -7.0 | -1.6 | 4.1 | 23.8 |
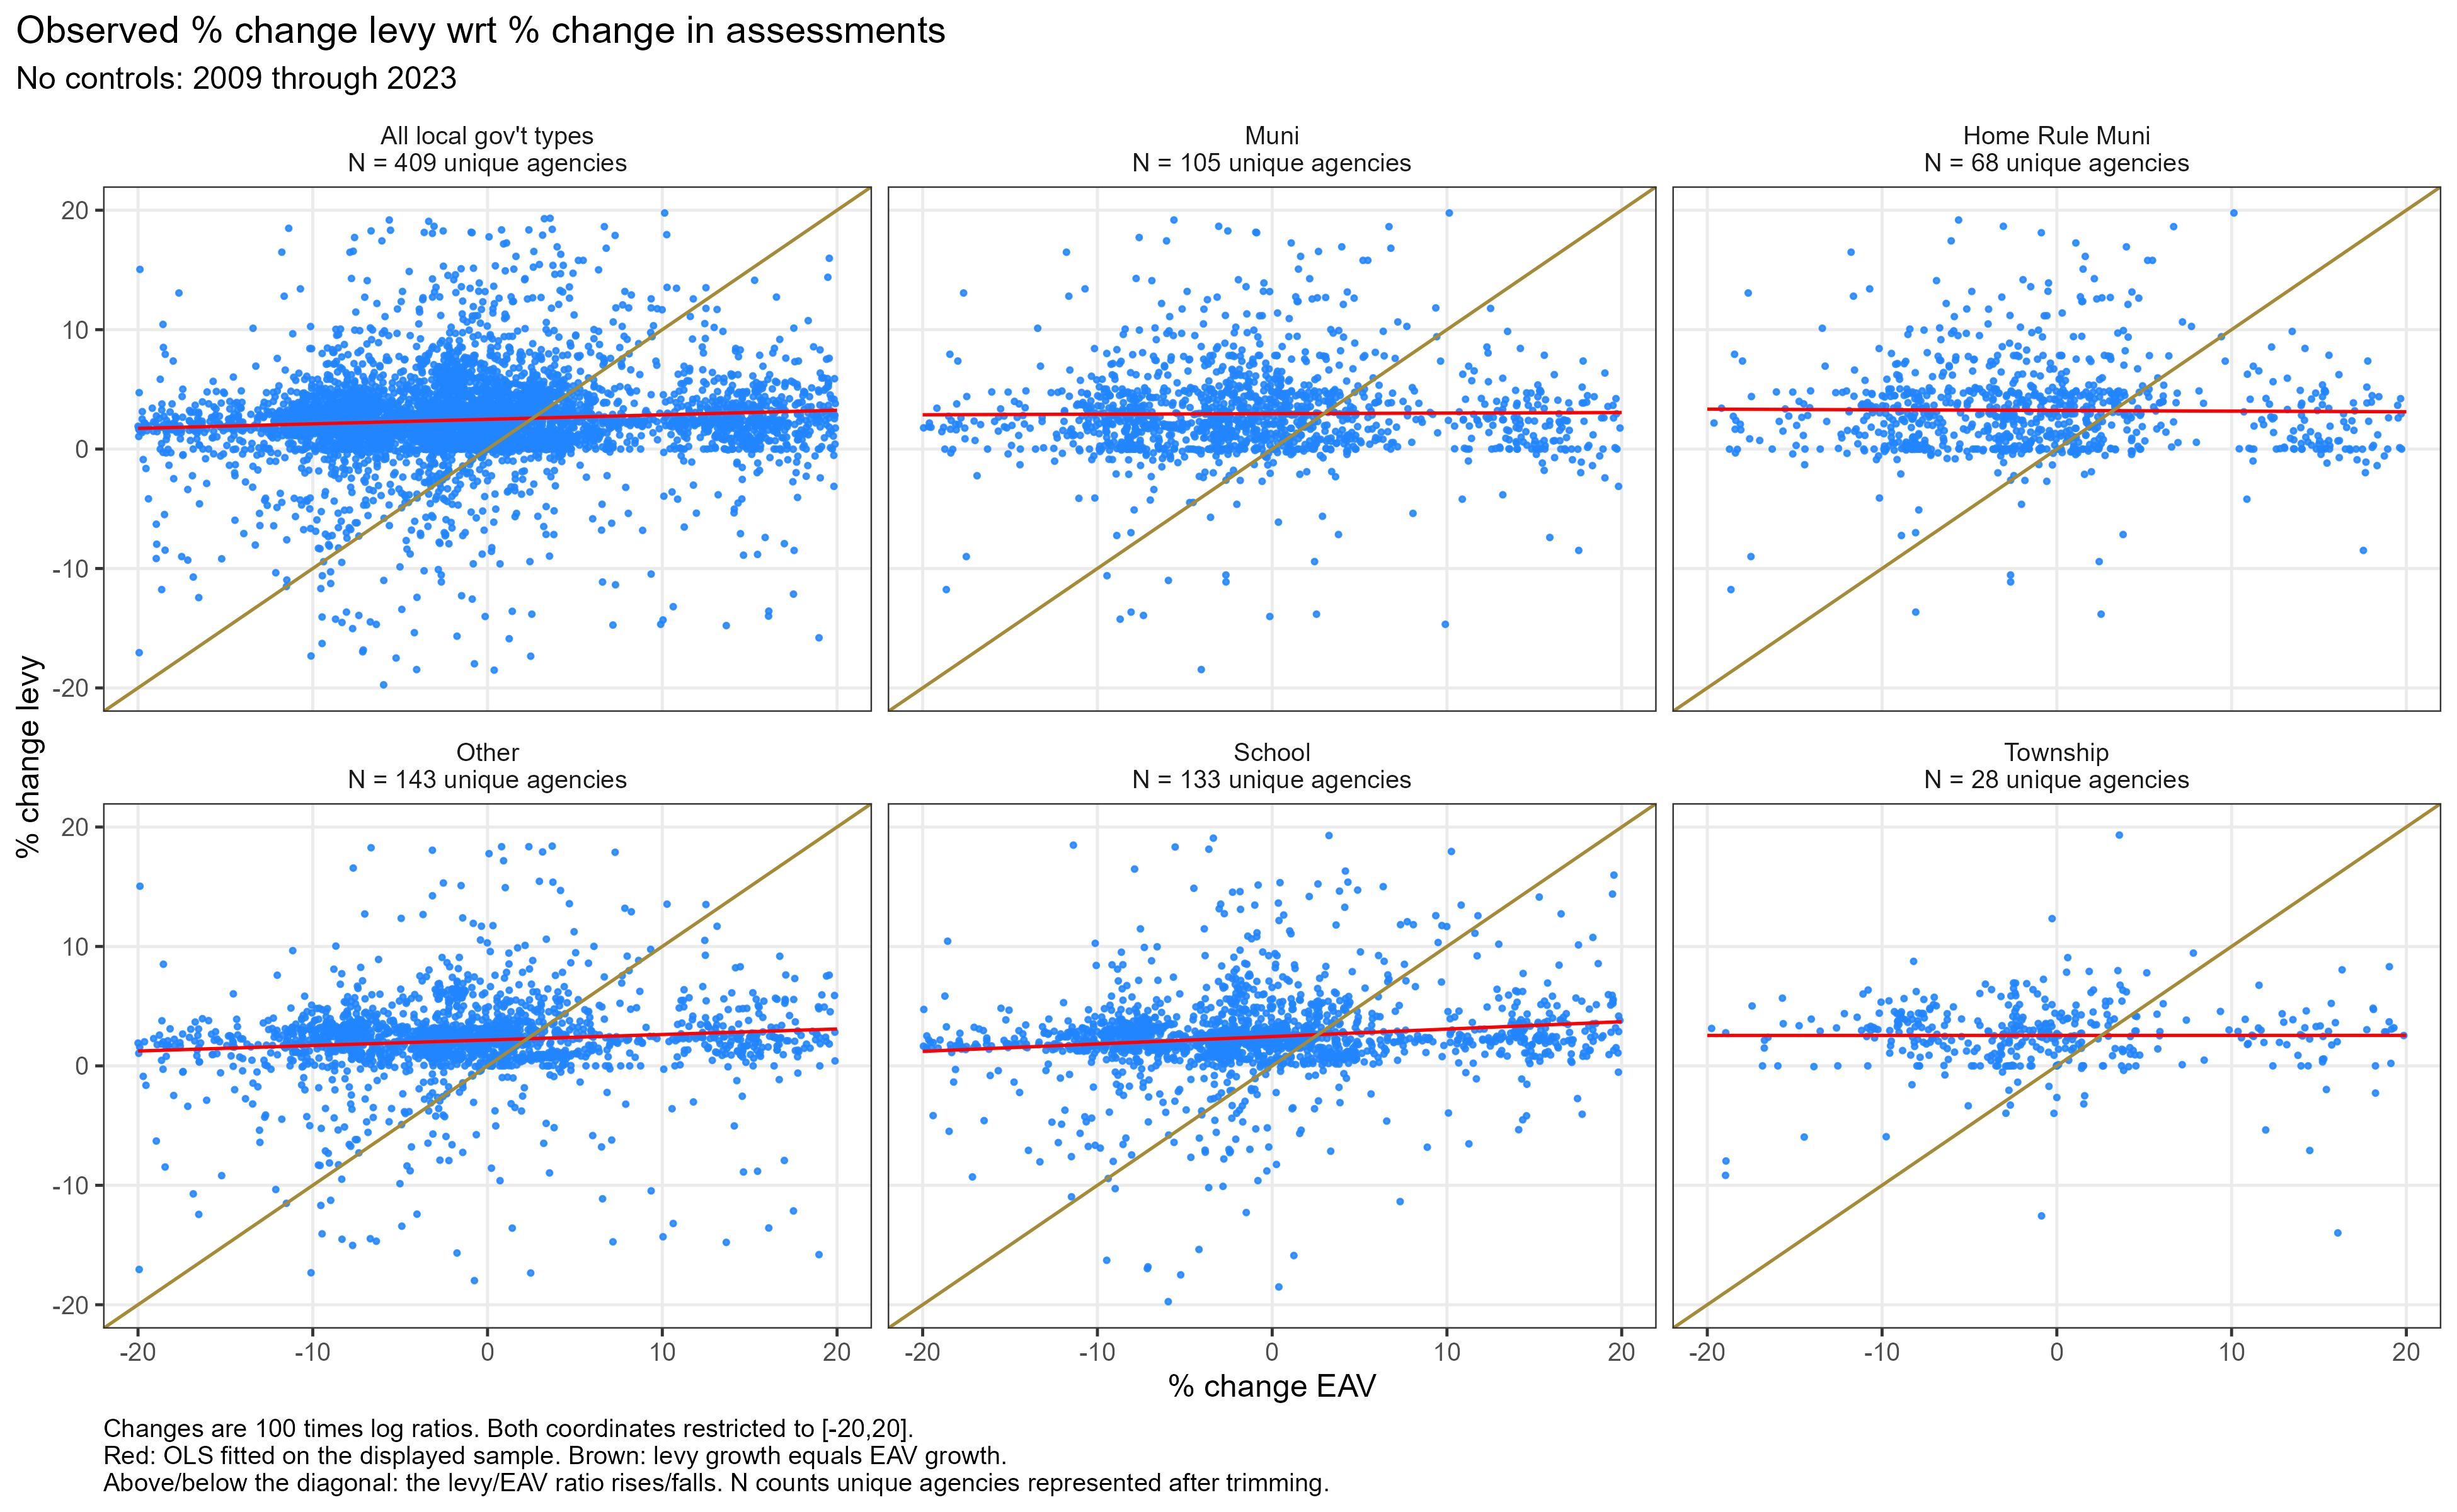
Each point represents an agency-year. Both growth rates are restricted to ±20 (100 times annual log ratios). Red lines fit OLS with an intercept to the displayed observations; brown lines show equal levy and EAV growth. Each panel’s N counts unique agencies (distinct agency_group values) with at least one observation remaining after trimming during 2009–2023. An agency is counted once within each panel regardless of how many years it contributes. Home-rule municipalities are also included in the municipal and all-agency panels, so counts across panels should not be added together.
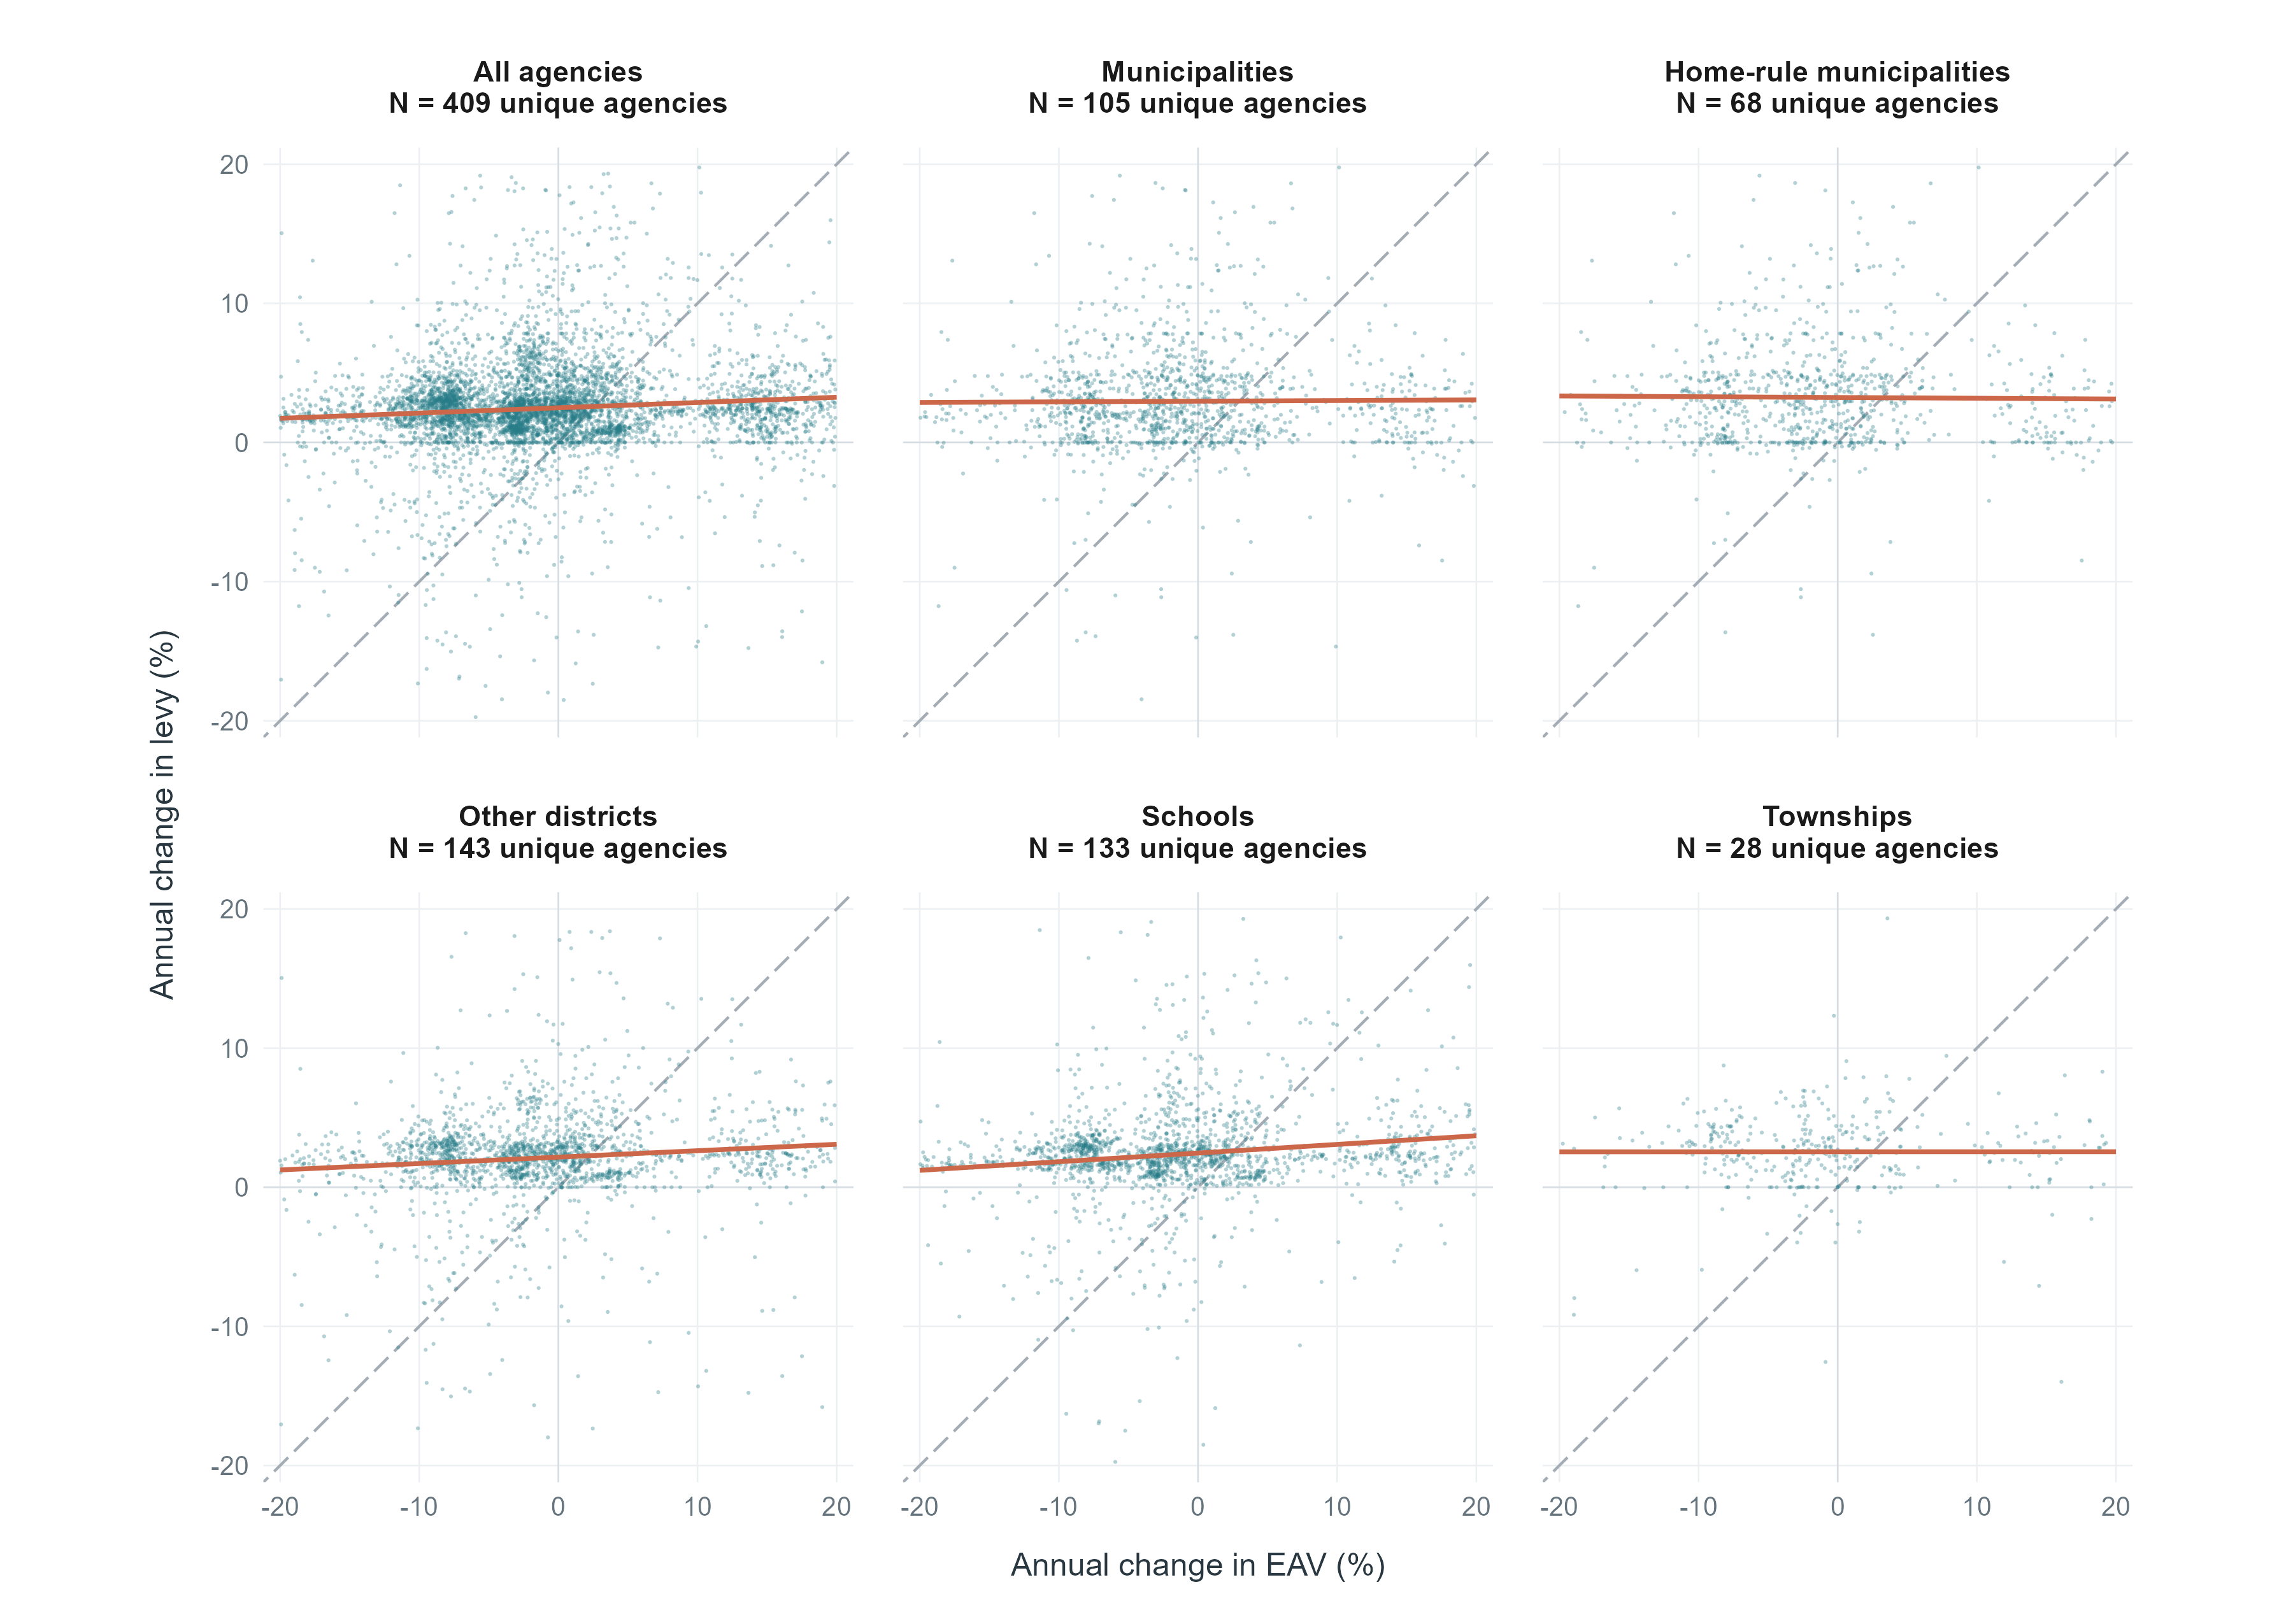
This version shows the same observations and fits, with equal axis scales and the explanatory text outside the image. Teal points represent agency-years, terracotta lines show OLS fits, and dashed gray diagonals mark equal levy and EAV growth. The years and sample restrictions are the same as above.
include_table("v22_table_02_OLS_all_agencies.html")| M1 | M2 | M3 | |
|---|---|---|---|
| * p < 0.1, ** p < 0.05, *** p < 0.01 | |||
| Cook County, Illinois data from 2008 through 2023. | |||
| Columns 2 and 3 include year-by-home-rule fixed effects; column 3 includes unit fixed effects. | |||
| Standard errors are clustered by taxing agency. upper_bound is estimate + 1.645 * clustered SE. | |||
| Change in EAV | 0.071*** | 0.090*** | 0.074*** |
| (0.010) | (0.025) | (0.022) | |
| N | 6132 | 6132 | 6130 |
| upper_bound | 0.088 | 0.131 | 0.110 |
include_table("v22_table_02_OLS_all_agencies_upper_bounds.html")| model | N | estimate | std_error | p_value | upper_bound |
|---|---|---|---|---|---|
| M1 | 6132 | 0.071*** | 0.010 | 0.000 | 0.088 |
| M2 | 6132 | 0.090*** | 0.025 | 0.000 | 0.131 |
| M3 | 6130 | 0.074*** | 0.022 | 0.001 | 0.110 |
include_table("v22_table_03_IV_all_agencies.html")| M1 | M2 | M3 | |
|---|---|---|---|
| * p < 0.1, ** p < 0.05, *** p < 0.01 | |||
| Cook County, Illinois data from 2008 through 2023. | |||
| Columns 2 and 3 include year-by-home-rule fixed effects; column 3 includes unit fixed effects. | |||
| d_eav is treated as endogenous and instrumented by reassessment year. | |||
| Standard errors are clustered by taxing agency. p_exog is a cluster-robust control-function test of the null that d_eav is exogenous. regF is the first-stage F statistic. | |||
| Change in EAV | −0.011 | −0.091 | −0.092 |
| (0.031) | (0.063) | (0.063) | |
| N | 6132 | 6132 | 6130 |
| upper_bound | 0.040 | 0.012 | 0.011 |
| p_exog | 0.010 | 0.010 | 0.014 |
| regF | 3690.6 | 2381.2 | 2368.1 |
The coefficient test asks whether the IV estimate differs from zero. p_exog asks whether OLS treatment of EAV growth as exogenous appears defensible. The first-stage statistic asks whether reassessment year predicts EAV growth strongly enough to identify the IV coefficient.
Failure to reject exogeneity also does not prove exogeneity, especially when the instrument is weak
include_table("v22_table_03_IV_all_agencies_upper_bounds.html")| model | N | estimate | std_error | p_value | upper_bound | first_stage_F | p_exog |
|---|---|---|---|---|---|---|---|
| M1 | 6132 | -0.011 | 0.031 | 0.724 | 0.040 | 3690.6 | 0.010 |
| M2 | 6132 | -0.091 | 0.063 | 0.146 | 0.012 | 2381.2 | 0.010 |
| M3 | 6130 | -0.092 | 0.063 | 0.144 | 0.011 | 2368.1 | 0.014 |
Comparing stars across columns does not show if agency types differ. It does not imply that the school and township coefficients differ significantly. A formal comparison requires a pooled interaction model or an appropriate cross-group Wald test. Text shouldn’t say significant for schools and not significant for townships, for example.
include_table("v22_table_04_OLS_by_type_upper_bounds.html")| row | Home-rule municipalities | Non-home-rule municipalities | Other | Townships | Schools |
|---|---|---|---|---|---|
| No controls | 0.058 | 0.075 | 0.123 | 0.054 | 0.126 |
| Year FE | 0.163 | 0.045 | 0.180 | 0.063 | 0.187 |
| Year + unit FE | 0.149 | 0.027 | 0.145 | 0.064 | 0.167 |
| IG revenue + year + unit FE | 0.424 | 0.353 | NA | NA | 0.265 |
| Same sample as IG row, no IG control | 0.422 | 0.326 | NA | NA | 0.264 |
| Enrollment + year + unit FE | NA | NA | NA | NA | 0.264 |
include_table("v22_table_04_OLS_by_type_upper_bounds_long.html")| row | agency | N | estimate | std_error | p_value | upper_bound |
|---|---|---|---|---|---|---|
| No controls | Home-rule municipalities | 1001 | 0.015 | 0.026 | 0.578 | 0.058 |
| No controls | Non-home-rule municipalities | 571 | 0.039* | 0.022 | 0.087 | 0.075 |
| No controls | Other | 2145 | 0.093*** | 0.018 | 0.000 | 0.123 |
| No controls | Townships | 420 | 0.009 | 0.027 | 0.737 | 0.054 |
| No controls | Schools | 1995 | 0.096*** | 0.018 | 0.000 | 0.126 |
| Year FE | Home-rule municipalities | 1001 | 0.077 | 0.052 | 0.148 | 0.163 |
| Year FE | Non-home-rule municipalities | 571 | -0.034 | 0.048 | 0.484 | 0.045 |
| Year FE | Other | 2145 | 0.109** | 0.044 | 0.014 | 0.180 |
| Year FE | Townships | 420 | 0.018 | 0.027 | 0.502 | 0.063 |
| Year FE | Schools | 1995 | 0.114** | 0.044 | 0.010 | 0.187 |
| Year + unit FE | Home-rule municipalities | 1001 | 0.071 | 0.048 | 0.140 | 0.149 |
| Year + unit FE | Non-home-rule municipalities | 571 | -0.051 | 0.047 | 0.286 | 0.027 |
| Year + unit FE | Other | 2143 | 0.085** | 0.036 | 0.021 | 0.145 |
| Year + unit FE | Townships | 420 | 0.018 | 0.028 | 0.509 | 0.064 |
| Year + unit FE | Schools | 1995 | 0.102** | 0.040 | 0.011 | 0.167 |
| IG revenue + year + unit FE | Home-rule municipalities | 479 | 0.229* | 0.119 | 0.059 | 0.424 |
| IG revenue + year + unit FE | Non-home-rule municipalities | 98 | 0.127 | 0.137 | 0.365 | 0.353 |
| IG revenue + year + unit FE | Schools | 1722 | 0.157** | 0.066 | 0.019 | 0.265 |
| Same sample as IG row, no IG control | Home-rule municipalities | 479 | 0.229* | 0.118 | 0.057 | 0.422 |
| Same sample as IG row, no IG control | Non-home-rule municipalities | 98 | 0.117 | 0.127 | 0.371 | 0.326 |
| Same sample as IG row, no IG control | Schools | 1722 | 0.156** | 0.066 | 0.019 | 0.264 |
| Enrollment + year + unit FE | Schools | 1722 | 0.155** | 0.066 | 0.021 | 0.264 |
Shows whether the IV coefficient differs from zero separately by agency type.
The table should report, for every model:
a cluster-robust first-stage Wald/Kleibergen–Paap statistic;
first-stage partial R2, if practical;
a weak-IV-robust confidence interval or test when strength is questionable;
optionally the exogeneity-test p-value.
include_table("v22_table_05_IV_by_type_upper_bounds.html")| row | Home-rule municipalities | Non-home-rule municipalities | Other | Townships | Schools |
|---|---|---|---|---|---|
| No controls | 0.027 | 0.061 | 0.080 | 0.043 | 0.108 |
| Year FE | 0.085 | 0.167 | 0.087 | 0.081 | 0.065 |
| Year + unit FE | 0.085 | 0.167 | 0.087 | 0.081 | 0.065 |
| IG revenue + year + unit FE | 0.136 | 0.240 | NA | NA | 0.128 |
| Same sample as IG row, no IG control | 0.138 | 0.228 | NA | NA | 0.130 |
| Enrollment + year + unit FE | NA | NA | NA | NA | 0.121 |
include_table("v22_table_05_IV_by_type_upper_bounds_long.html")| row | agency | N | estimate | std_error | p_value | upper_bound | first_stage_F | p_exog |
|---|---|---|---|---|---|---|---|---|
| No controls | Home-rule municipalities | 1001 | -0.045 | 0.044 | 0.311 | 0.027 | 530.4 | 0.289 |
| No controls | Non-home-rule municipalities | 571 | -0.029 | 0.055 | 0.597 | 0.061 | 604.6 | 0.311 |
| No controls | Other | 2145 | -0.052 | 0.080 | 0.515 | 0.080 | 1018.2 | 0.068 |
| No controls | Townships | 420 | -0.058 | 0.061 | 0.350 | 0.043 | 687.3 | 0.239 |
| No controls | Schools | 1995 | 0.065** | 0.026 | 0.015 | 0.108 | 1307.5 | 0.330 |
| Year FE | Home-rule municipalities | 1001 | -0.030 | 0.070 | 0.668 | 0.085 | 366.2 | 0.283 |
| Year FE | Non-home-rule municipalities | 571 | -0.053 | 0.134 | 0.694 | 0.167 | 25.8 | 0.895 |
| Year FE | Other | 2145 | -0.208 | 0.179 | 0.248 | 0.087 | 698.3 | 0.088 |
| Year FE | Townships | 420 | -0.064 | 0.088 | 0.473 | 0.081 | 1202.9 | 0.277 |
| Year FE | Schools | 1995 | 0.011 | 0.033 | 0.734 | 0.065 | 814.6 | 0.075 |
| Year + unit FE | Home-rule municipalities | 1001 | -0.031 | 0.070 | 0.664 | 0.085 | 362.2 | 0.289 |
| Year + unit FE | Non-home-rule municipalities | 571 | -0.061 | 0.139 | 0.661 | 0.167 | 23.9 | 0.947 |
| Year + unit FE | Other | 2143 | -0.208 | 0.180 | 0.248 | 0.087 | 698.9 | 0.103 |
| Year + unit FE | Townships | 420 | -0.064 | 0.088 | 0.473 | 0.081 | 1202.9 | 0.261 |
| Year + unit FE | Schools | 1995 | 0.011 | 0.033 | 0.742 | 0.065 | 816.4 | 0.090 |
| IG revenue + year + unit FE | Home-rule municipalities | 479 | -0.514 | 0.395 | 0.199 | 0.136 | 7.3 | 0.060 |
| IG revenue + year + unit FE | Non-home-rule municipalities | 98 | -0.108 | 0.212 | 0.616 | 0.240 | 2.4 | 0.086 |
| IG revenue + year + unit FE | Schools | 1722 | -0.037 | 0.100 | 0.714 | 0.128 | 122.0 | 0.135 |
| Same sample as IG row, no IG control | Home-rule municipalities | 479 | -0.514 | 0.396 | 0.200 | 0.138 | 7.3 | 0.062 |
| Same sample as IG row, no IG control | Non-home-rule municipalities | 98 | -0.109 | 0.205 | 0.601 | 0.228 | 2.3 | 0.085 |
| Same sample as IG row, no IG control | Schools | 1722 | -0.035 | 0.101 | 0.728 | 0.130 | 122.4 | 0.141 |
| Enrollment + year + unit FE | Schools | 1722 | -0.045 | 0.101 | 0.659 | 0.121 | 123.1 | 0.122 |
include_table(
  "v22_table_05_C_IV_by_type_diagnostics.html"
)| row | agency | N | first_stage_F | p_exog |
|---|---|---|---|---|
| No controls | Home-rule municipalities | 1001 | 530.4 | 0.289 |
| No controls | Non-home-rule municipalities | 571 | 604.6 | 0.311 |
| No controls | Other | 2145 | 1018.2 | 0.068 |
| No controls | Townships | 420 | 687.3 | 0.239 |
| No controls | Schools | 1995 | 1307.5 | 0.330 |
| Year FE | Home-rule municipalities | 1001 | 366.2 | 0.283 |
| Year FE | Non-home-rule municipalities | 571 | 25.8 | 0.895 |
| Year FE | Other | 2145 | 698.3 | 0.088 |
| Year FE | Townships | 420 | 1202.9 | 0.277 |
| Year FE | Schools | 1995 | 814.6 | 0.075 |
| Year + unit FE | Home-rule municipalities | 1001 | 362.2 | 0.289 |
| Year + unit FE | Non-home-rule municipalities | 571 | 23.9 | 0.947 |
| Year + unit FE | Other | 2143 | 698.9 | 0.103 |
| Year + unit FE | Townships | 420 | 1202.9 | 0.261 |
| Year + unit FE | Schools | 1995 | 816.4 | 0.090 |
| IG revenue + year + unit FE | Home-rule municipalities | 479 | 7.3 | 0.060 |
| IG revenue + year + unit FE | Non-home-rule municipalities | 98 | 2.4 | 0.086 |
| IG revenue + year + unit FE | Schools | 1722 | 122.0 | 0.135 |
| Same sample as IG row, no IG control | Home-rule municipalities | 479 | 7.3 | 0.062 |
| Same sample as IG row, no IG control | Non-home-rule municipalities | 98 | 2.3 | 0.085 |
| Same sample as IG row, no IG control | Schools | 1722 | 122.4 | 0.141 |
| Enrollment + year + unit FE | Schools | 1722 | 123.1 | 0.122 |
include_table("v22_table_06_OLS_all_agencies_asym.html")| M1 | M2 | M3 | |
|---|---|---|---|
| * p < 0.1, ** p < 0.05, *** p < 0.01 | |||
| Standard errors are clustered by taxing agency. | |||
| p_equal tests equality of the positive- and negative-EAV coefficients. | |||
| pos_upper_bound and neg_upper_bound equal the corresponding coefficient plus 1.645 times the clustered SE. neg_d_eav is coded as the actual negative value of d_eav when EAV declines. | |||
| Positive EAV change | 0.068*** | 0.092** | 0.082** |
| (0.017) | (0.036) | (0.035) | |
| Negative EAV change | 0.078*** | 0.081 | 0.044 |
| (0.025) | (0.086) | (0.089) | |
| N | 6132 | 6132 | 6130 |
| p_equal | 0.777 | 0.920 | 0.744 |
| pos_upper_bound | 0.096 | 0.152 | 0.140 |
| neg_upper_bound | 0.119 | 0.223 | 0.191 |
include_table("v22_table_06_OLS_all_agencies_asym_upper_bounds.html")| model | component | N | estimate | std_error | p_value | upper_bound | p_equal |
|---|---|---|---|---|---|---|---|
| M1 | Positive EAV change | 6132 | 0.068*** | 0.017 | 0.000 | 0.096 | 0.777 |
| M1 | Negative EAV change | 6132 | 0.078*** | 0.025 | 0.002 | 0.119 | 0.777 |
| M2 | Positive EAV change | 6132 | 0.092** | 0.036 | 0.012 | 0.152 | 0.920 |
| M2 | Negative EAV change | 6132 | 0.081 | 0.086 | 0.350 | 0.223 | 0.920 |
| M3 | Positive EAV change | 6130 | 0.082** | 0.035 | 0.020 | 0.140 | 0.744 |
| M3 | Negative EAV change | 6130 | 0.044 | 0.089 | 0.618 | 0.191 | 0.744 |
include_table("v22_table_06_B_OLS_all_agencies_asym_pos_neg_upper_bounds.html")| model | component | N | estimate | std_error | p_value | upper_bound | p_equal |
|---|---|---|---|---|---|---|---|
| M1 | Positive EAV change | 6132 | 0.068*** | 0.017 | 0.000 | 0.096 | 0.777 |
| M1 | Negative EAV change | 6132 | 0.078*** | 0.025 | 0.002 | 0.119 | 0.777 |
| M2 | Positive EAV change | 6132 | 0.092** | 0.036 | 0.012 | 0.152 | 0.920 |
| M2 | Negative EAV change | 6132 | 0.081 | 0.086 | 0.350 | 0.223 | 0.920 |
| M3 | Positive EAV change | 6130 | 0.082** | 0.035 | 0.020 | 0.140 | 0.744 |
| M3 | Negative EAV change | 6130 | 0.044 | 0.089 | 0.618 | 0.191 | 0.744 |
include_table("v22_table_07_IV_all_agencies_asym.html")| M1 | M2 | M3 | |
|---|---|---|---|
| * p < 0.1, ** p < 0.05, *** p < 0.01 | |||
| Standard errors are clustered by taxing agency. | |||
| F_neg and F_pos are equation-specific, cluster-robust first-stage Wald statistics. | |||
| SW_F_neg and SW_F_pos are Sanderson-Windmeijer conditional F statistics for the two endogenous variables. | |||
| p_exog is a cluster-robust joint control-function test that the positive and negative EAV variables are exogenous. | |||
| p_equal tests equality of the positive- and negative-EAV coefficients. | |||
| pos_upper_bound and neg_upper_bound equal the corresponding coefficient plus 1.645 times the clustered SE. neg_d_eav is coded as the actual negative value of d_eav when EAV declines. | |||
| Positive EAV change | 0.004 | −0.051 | −0.051 |
| (0.027) | (0.042) | (0.042) | |
| Negative EAV change | 0.114*** | 0.060 | 0.061 |
| (0.034) | (0.050) | (0.050) | |
| N | 6132 | 6132 | 6130 |
| F_neg | 8756.8 | 1082.0 | 1068.0 |
| F_pos | 4244.6 | 2646.1 | 2628.1 |
| SW_F_neg | 3909.9 | 1959.8 | 1945.7 |
| SW_F_pos | 4633.3 | 5118.0 | 5099.5 |
| p_exog | 0.156 | 0.009 | 0.012 |
| p_equal | 0.014 | 0.107 | 0.104 |
| pos_upper_bound | 0.048 | 0.019 | 0.019 |
| neg_upper_bound | 0.170 | 0.142 | 0.144 |
include_table("v22_table_07_IV_all_agencies_asym_upper_bounds.html")| model | component | N | estimate | std_error | p_value | upper_bound | F_neg | F_pos | SW_F_neg | SW_F_pos | p_exog | p_equal |
|---|---|---|---|---|---|---|---|---|---|---|---|---|
| M1 | Positive EAV change | 6132 | 0.004 | 0.027 | 0.883 | 0.048 | 8756.8 | 4244.6 | 3909.9 | 4633.3 | 0.156 | 0.014 |
| M1 | Negative EAV change | 6132 | 0.114*** | 0.034 | 0.001 | 0.170 | 8756.8 | 4244.6 | 3909.9 | 4633.3 | 0.156 | 0.014 |
| M2 | Positive EAV change | 6132 | -0.051 | 0.042 | 0.233 | 0.019 | 1082.0 | 2646.1 | 1959.8 | 5118.0 | 0.009 | 0.107 |
| M2 | Negative EAV change | 6132 | 0.060 | 0.050 | 0.227 | 0.142 | 1082.0 | 2646.1 | 1959.8 | 5118.0 | 0.009 | 0.107 |
| M3 | Positive EAV change | 6130 | -0.051 | 0.042 | 0.234 | 0.019 | 1068.0 | 2628.1 | 1945.7 | 5099.5 | 0.012 | 0.104 |
| M3 | Negative EAV change | 6130 | 0.061 | 0.050 | 0.220 | 0.144 | 1068.0 | 2628.1 | 1945.7 | 5099.5 | 0.012 | 0.104 |
include_table("v22_table_07_B_IV_all_agencies_asym_pos_neg_upper_bounds.html")| model | component | N | estimate | std_error | p_value | upper_bound | F_neg | F_pos | SW_F_neg | SW_F_pos | p_exog | p_equal |
|---|---|---|---|---|---|---|---|---|---|---|---|---|
| M1 | Positive EAV change | 6132 | 0.004 | 0.027 | 0.883 | 0.048 | 8756.8 | 4244.6 | 3909.9 | 4633.3 | 0.156 | 0.014 |
| M1 | Negative EAV change | 6132 | 0.114*** | 0.034 | 0.001 | 0.170 | 8756.8 | 4244.6 | 3909.9 | 4633.3 | 0.156 | 0.014 |
| M2 | Positive EAV change | 6132 | -0.051 | 0.042 | 0.233 | 0.019 | 1082.0 | 2646.1 | 1959.8 | 5118.0 | 0.009 | 0.107 |
| M2 | Negative EAV change | 6132 | 0.060 | 0.050 | 0.227 | 0.142 | 1082.0 | 2646.1 | 1959.8 | 5118.0 | 0.009 | 0.107 |
| M3 | Positive EAV change | 6130 | -0.051 | 0.042 | 0.234 | 0.019 | 1068.0 | 2628.1 | 1945.7 | 5099.5 | 0.012 | 0.104 |
| M3 | Negative EAV change | 6130 | 0.061 | 0.050 | 0.220 | 0.144 | 1068.0 | 2628.1 | 1945.7 | 5099.5 | 0.012 | 0.104 |
include_table("v22_table_07_C_IV_all_agencies_asym_first_stage.html")| model | N | F_neg | F_pos | SW_F_neg | SW_F_pos | p_exog |
|---|---|---|---|---|---|---|
| M1 | 6132 | 8756.8 | 4244.6 | 3909.9 | 4633.3 | 0.156 |
| M2 | 6132 | 1082.0 | 2646.1 | 1959.8 | 5118.0 | 0.009 |
| M3 | 6130 | 1068.0 | 2628.1 | 1945.7 | 5099.5 | 0.012 |
include_table("v22_table_07_D_IV_all_agencies_asym_alt_neg_instrument_pos_neg_upper_bounds.html")| model | component | N | estimate | std_error | p_value | upper_bound | F_neg | F_pos | SW_F_neg | SW_F_pos | p_exog | p_equal |
|---|---|---|---|---|---|---|---|---|---|---|---|---|
| M1 | Positive EAV change | 6132 | 0.007 | 0.023 | 0.764 | 0.045 | 2640.9 | 2185.9 | 5915.4 | 5239.9 | 0.085 | 0.037 |
| M1 | Negative EAV change | 6132 | 0.140*** | 0.044 | 0.002 | 0.213 | 2640.9 | 2185.9 | 5915.4 | 5239.9 | 0.085 | 0.037 |
| M2 | Positive EAV change | 6132 | -0.051 | 0.042 | 0.233 | 0.019 | 1082.0 | 2646.1 | 1959.8 | 5118.0 | 0.009 | 0.107 |
| M2 | Negative EAV change | 6132 | 0.060 | 0.050 | 0.227 | 0.142 | 1082.0 | 2646.1 | 1959.8 | 5118.0 | 0.009 | 0.107 |
| M3 | Positive EAV change | 6130 | -0.051 | 0.042 | 0.234 | 0.019 | 1068.0 | 2628.1 | 1945.7 | 5099.5 | 0.012 | 0.104 |
| M3 | Negative EAV change | 6130 | 0.061 | 0.050 | 0.220 | 0.144 | 1068.0 | 2628.1 | 1945.7 | 5099.5 | 0.012 | 0.104 |
include_table("v22_table_08_OLS_by_type_asym_upper_bounds.html")| row | Home-rule municipalities | Non-home-rule municipalities | Other | Townships | Schools |
|---|---|---|---|---|---|
| No controls | 0.080 | 0.030 | 0.135 | 0.053 | 0.165 |
| Year FE | 0.188 | 0.116 | 0.238 | 0.038 | 0.191 |
| Year + unit FE | 0.168 | 0.105 | 0.223 | 0.037 | 0.177 |
| IG revenue + year + unit FE | 0.576 | 0.510 | NA | NA | 0.331 |
| Same sample as IG row, no IG control | 0.574 | 0.490 | NA | NA | 0.330 |
| Enrollment + year + unit FE | NA | NA | NA | NA | 0.330 |
include_table("v22_table_08_OLS_by_type_asym_upper_bounds_long.html")| row | agency | N | estimate | std_error | p_value | upper_bound | p_equal |
|---|---|---|---|---|---|---|---|
| No controls | Home-rule municipalities | 1001 | 0.004 | 0.046 | 0.932 | 0.080 | 0.649 |
| No controls | Non-home-rule municipalities | 571 | -0.007 | 0.022 | 0.763 | 0.030 | 0.201 |
| No controls | Other | 2145 | 0.087*** | 0.030 | 0.004 | 0.135 | 0.813 |
| No controls | Townships | 420 | 0.014 | 0.024 | 0.573 | 0.053 | 0.815 |
| No controls | Schools | 1995 | 0.111*** | 0.033 | 0.001 | 0.165 | 0.392 |
| Year FE | Home-rule municipalities | 1001 | 0.083 | 0.064 | 0.199 | 0.188 | 0.713 |
| Year FE | Non-home-rule municipalities | 571 | 0.027 | 0.054 | 0.625 | 0.116 | 0.170 |
| Year FE | Other | 2145 | 0.123* | 0.070 | 0.083 | 0.238 | 0.803 |
| Year FE | Townships | 420 | -0.022 | 0.037 | 0.555 | 0.038 | 0.037 |
| Year FE | Schools | 1995 | 0.102* | 0.054 | 0.059 | 0.191 | 0.334 |
| Year + unit FE | Home-rule municipalities | 1001 | 0.070 | 0.060 | 0.249 | 0.168 | 0.937 |
| Year + unit FE | Non-home-rule municipalities | 571 | 0.016 | 0.054 | 0.765 | 0.105 | 0.132 |
| Year + unit FE | Other | 2143 | 0.110 | 0.069 | 0.113 | 0.223 | 0.667 |
| Year + unit FE | Townships | 420 | -0.025 | 0.037 | 0.513 | 0.037 | 0.032 |
| Year + unit FE | Schools | 1995 | 0.096* | 0.049 | 0.053 | 0.177 | 0.632 |
| IG revenue + year + unit FE | Home-rule municipalities | 479 | 0.293* | 0.172 | 0.095 | 0.576 | 0.320 |
| IG revenue + year + unit FE | Non-home-rule municipalities | 98 | 0.195 | 0.192 | 0.322 | 0.510 | 0.581 |
| IG revenue + year + unit FE | Schools | 1722 | 0.175* | 0.095 | 0.067 | 0.331 | 0.594 |
| Same sample as IG row, no IG control | Home-rule municipalities | 479 | 0.293* | 0.171 | 0.093 | 0.574 | 0.319 |
| Same sample as IG row, no IG control | Non-home-rule municipalities | 98 | 0.182 | 0.188 | 0.345 | 0.490 | 0.587 |
| Same sample as IG row, no IG control | Schools | 1722 | 0.175* | 0.095 | 0.067 | 0.330 | 0.585 |
| Enrollment + year + unit FE | Schools | 1722 | 0.174* | 0.095 | 0.070 | 0.330 | 0.580 |
include_table("v22_table_08_B_OLS_by_type_asym_pos_neg_upper_bounds.html")| row | Home-rule municipalities | Non-home-rule municipalities | Other | Townships | Schools |
|---|---|---|---|---|---|
| No controls - Positive EAV change | 0.080 | 0.030 | 0.135 | 0.053 | 0.165 |
| No controls - Negative EAV change | 0.090 | 0.267 | 0.196 | 0.091 | 0.105 |
| Year FE - Positive EAV change | 0.188 | 0.116 | 0.238 | 0.038 | 0.191 |
| Year FE - Negative EAV change | 0.152 | 0.042 | 0.378 | 0.365 | 0.236 |
| Year + unit FE - Positive EAV change | 0.168 | 0.105 | 0.223 | 0.037 | 0.177 |
| Year + unit FE - Negative EAV change | 0.182 | 0.005 | 0.328 | 0.386 | 0.204 |
| IG revenue + year + unit FE - Positive EAV change | 0.576 | 0.510 | NA | NA | 0.331 |
| IG revenue + year + unit FE - Negative EAV change | 0.198 | 0.342 | NA | NA | 0.189 |
| Same sample as IG row, no IG control - Positive EAV change | 0.574 | 0.490 | NA | NA | 0.330 |
| Same sample as IG row, no IG control - Negative EAV change | 0.198 | 0.312 | NA | NA | 0.187 |
| Enrollment + year + unit FE - Positive EAV change | NA | NA | NA | NA | 0.330 |
| Enrollment + year + unit FE - Negative EAV change | NA | NA | NA | NA | 0.184 |
include_table("v22_table_08_B_OLS_by_type_asym_pos_neg_upper_bounds_long.html")| row | agency | component | N | estimate | std_error | p_value | upper_bound | p_equal |
|---|---|---|---|---|---|---|---|---|
| No controls | Home-rule municipalities | Positive EAV change | 1001 | 0.004 | 0.046 | 0.932 | 0.080 | 0.649 |
| No controls | Home-rule municipalities | Negative EAV change | 1001 | 0.036 | 0.033 | 0.289 | 0.090 | 0.649 |
| No controls | Non-home-rule municipalities | Positive EAV change | 571 | -0.007 | 0.022 | 0.763 | 0.030 | 0.201 |
| No controls | Non-home-rule municipalities | Negative EAV change | 571 | 0.126 | 0.086 | 0.149 | 0.267 | 0.201 |
| No controls | Other | Positive EAV change | 2145 | 0.087*** | 0.030 | 0.004 | 0.135 | 0.813 |
| No controls | Other | Negative EAV change | 2145 | 0.105* | 0.055 | 0.061 | 0.196 | 0.813 |
| No controls | Townships | Positive EAV change | 420 | 0.014 | 0.024 | 0.573 | 0.053 | 0.815 |
| No controls | Townships | Negative EAV change | 420 | 0.001 | 0.055 | 0.990 | 0.091 | 0.815 |
| No controls | Schools | Positive EAV change | 1995 | 0.111*** | 0.033 | 0.001 | 0.165 | 0.392 |
| No controls | Schools | Negative EAV change | 1995 | 0.067*** | 0.023 | 0.004 | 0.105 | 0.392 |
| Year FE | Home-rule municipalities | Positive EAV change | 1001 | 0.083 | 0.064 | 0.199 | 0.188 | 0.713 |
| Year FE | Home-rule municipalities | Negative EAV change | 1001 | 0.049 | 0.063 | 0.438 | 0.152 | 0.713 |
| Year FE | Non-home-rule municipalities | Positive EAV change | 571 | 0.027 | 0.054 | 0.625 | 0.116 | 0.170 |
| Year FE | Non-home-rule municipalities | Negative EAV change | 571 | -0.219 | 0.159 | 0.175 | 0.042 | 0.170 |
| Year FE | Other | Positive EAV change | 2145 | 0.123* | 0.070 | 0.083 | 0.238 | 0.803 |
| Year FE | Other | Negative EAV change | 2145 | 0.063 | 0.192 | 0.745 | 0.378 | 0.803 |
| Year FE | Townships | Positive EAV change | 420 | -0.022 | 0.037 | 0.555 | 0.038 | 0.037 |
| Year FE | Townships | Negative EAV change | 420 | 0.218** | 0.089 | 0.021 | 0.365 | 0.037 |
| Year FE | Schools | Positive EAV change | 1995 | 0.102* | 0.054 | 0.059 | 0.191 | 0.334 |
| Year FE | Schools | Negative EAV change | 1995 | 0.169*** | 0.041 | 0.000 | 0.236 | 0.334 |
| Year + unit FE | Home-rule municipalities | Positive EAV change | 1001 | 0.070 | 0.060 | 0.249 | 0.168 | 0.937 |
| Year + unit FE | Home-rule municipalities | Negative EAV change | 1001 | 0.077 | 0.064 | 0.229 | 0.182 | 0.937 |
| Year + unit FE | Non-home-rule municipalities | Positive EAV change | 571 | 0.016 | 0.054 | 0.765 | 0.105 | 0.132 |
| Year + unit FE | Non-home-rule municipalities | Negative EAV change | 571 | -0.264 | 0.164 | 0.115 | 0.005 | 0.132 |
| Year + unit FE | Other | Positive EAV change | 2143 | 0.110 | 0.069 | 0.113 | 0.223 | 0.667 |
| Year + unit FE | Other | Negative EAV change | 2143 | 0.001 | 0.199 | 0.998 | 0.328 | 0.667 |
| Year + unit FE | Townships | Positive EAV change | 420 | -0.025 | 0.037 | 0.513 | 0.037 | 0.032 |
| Year + unit FE | Townships | Negative EAV change | 420 | 0.233** | 0.093 | 0.018 | 0.386 | 0.032 |
| Year + unit FE | Schools | Positive EAV change | 1995 | 0.096* | 0.049 | 0.053 | 0.177 | 0.632 |
| Year + unit FE | Schools | Negative EAV change | 1995 | 0.131*** | 0.044 | 0.004 | 0.204 | 0.632 |
| IG revenue + year + unit FE | Home-rule municipalities | Positive EAV change | 479 | 0.293* | 0.172 | 0.095 | 0.576 | 0.320 |
| IG revenue + year + unit FE | Home-rule municipalities | Negative EAV change | 479 | 0.094 | 0.063 | 0.143 | 0.198 | 0.320 |
| IG revenue + year + unit FE | Non-home-rule municipalities | Positive EAV change | 98 | 0.195 | 0.192 | 0.322 | 0.510 | 0.581 |
| IG revenue + year + unit FE | Non-home-rule municipalities | Negative EAV change | 98 | 0.031 | 0.189 | 0.871 | 0.342 | 0.581 |
| IG revenue + year + unit FE | Schools | Positive EAV change | 1722 | 0.175* | 0.095 | 0.067 | 0.331 | 0.594 |
| IG revenue + year + unit FE | Schools | Negative EAV change | 1722 | 0.114** | 0.046 | 0.014 | 0.189 | 0.594 |
| Same sample as IG row, no IG control | Home-rule municipalities | Positive EAV change | 479 | 0.293* | 0.171 | 0.093 | 0.574 | 0.319 |
| Same sample as IG row, no IG control | Home-rule municipalities | Negative EAV change | 479 | 0.093 | 0.063 | 0.147 | 0.198 | 0.319 |
| Same sample as IG row, no IG control | Non-home-rule municipalities | Positive EAV change | 98 | 0.182 | 0.188 | 0.345 | 0.490 | 0.587 |
| Same sample as IG row, no IG control | Non-home-rule municipalities | Negative EAV change | 98 | 0.023 | 0.176 | 0.899 | 0.312 | 0.587 |
| Same sample as IG row, no IG control | Schools | Positive EAV change | 1722 | 0.175* | 0.095 | 0.067 | 0.330 | 0.585 |
| Same sample as IG row, no IG control | Schools | Negative EAV change | 1722 | 0.112** | 0.045 | 0.015 | 0.187 | 0.585 |
| Enrollment + year + unit FE | Schools | Positive EAV change | 1722 | 0.174* | 0.095 | 0.070 | 0.330 | 0.580 |
| Enrollment + year + unit FE | Schools | Negative EAV change | 1722 | 0.111** | 0.045 | 0.015 | 0.184 | 0.580 |
include_table("v22_table_09_IV_by_type_asym_upper_bounds.html")| row | Home-rule municipalities | Non-home-rule municipalities | Other | Townships | Schools |
|---|---|---|---|---|---|
| No controls | 0.002 | 0.056 | 0.089 | 0.041 | 0.105 |
| Year FE | 0.040 | -0.027 | 0.091 | 0.072 | 0.041 |
| Year + unit FE | 0.041 | -0.028 | 0.092 | 0.071 | 0.040 |
| IG revenue + year + unit FE | 0.057 | 0.490 | NA | NA | 0.043 |
| Same sample as IG row, no IG control | 0.058 | 0.442 | NA | NA | 0.042 |
| Enrollment + year + unit FE | NA | NA | NA | NA | 0.037 |
include_table("v22_table_09_IV_by_type_asym_upper_bounds_long.html")| row | agency | N | estimate | std_error | p_value | upper_bound | p_equal |
|---|---|---|---|---|---|---|---|
| No controls | Home-rule municipalities | 1001 | -0.047 | 0.030 | 0.123 | 0.002 | 0.904 |
| No controls | Non-home-rule municipalities | 571 | -0.003 | 0.036 | 0.944 | 0.056 | 0.236 |
| No controls | Other | 2145 | -0.029 | 0.072 | 0.687 | 0.089 | 0.050 |
| No controls | Townships | 420 | -0.031 | 0.044 | 0.484 | 0.041 | 0.160 |
| No controls | Schools | 1995 | 0.072*** | 0.020 | 0.000 | 0.105 | 0.316 |
| Year FE | Home-rule municipalities | 1001 | -0.013 | 0.032 | 0.688 | 0.040 | 0.707 |
| Year FE | Non-home-rule municipalities | 571 | -0.085** | 0.035 | 0.021 | -0.027 | 0.786 |
| Year FE | Other | 2145 | -0.113 | 0.124 | 0.364 | 0.091 | 0.141 |
| Year FE | Townships | 420 | -0.021 | 0.056 | 0.709 | 0.072 | 0.230 |
| Year FE | Schools | 1995 | 0.010 | 0.019 | 0.615 | 0.041 | 0.936 |
| Year + unit FE | Home-rule municipalities | 1001 | -0.012 | 0.032 | 0.710 | 0.041 | 0.687 |
| Year + unit FE | Non-home-rule municipalities | 571 | -0.086** | 0.036 | 0.020 | -0.028 | 0.834 |
| Year + unit FE | Other | 2143 | -0.113 | 0.124 | 0.366 | 0.092 | 0.140 |
| Year + unit FE | Townships | 420 | -0.021 | 0.056 | 0.710 | 0.071 | 0.233 |
| Year + unit FE | Schools | 1995 | 0.009 | 0.019 | 0.640 | 0.040 | 0.924 |
| IG revenue + year + unit FE | Home-rule municipalities | 479 | -0.064 | 0.074 | 0.387 | 0.057 | 0.096 |
| IG revenue + year + unit FE | Non-home-rule municipalities | 98 | 0.299** | 0.116 | 0.019 | 0.490 | 0.042 |
| IG revenue + year + unit FE | Schools | 1722 | -0.012 | 0.033 | 0.723 | 0.043 | 0.745 |
| Same sample as IG row, no IG control | Home-rule municipalities | 479 | -0.065 | 0.075 | 0.387 | 0.058 | 0.098 |
| Same sample as IG row, no IG control | Non-home-rule municipalities | 98 | 0.270** | 0.105 | 0.018 | 0.442 | 0.051 |
| Same sample as IG row, no IG control | Schools | 1722 | -0.012 | 0.033 | 0.713 | 0.042 | 0.769 |
| Enrollment + year + unit FE | Schools | 1722 | -0.016 | 0.032 | 0.614 | 0.037 | 0.717 |
include_table("v22_table_09_B_IV_by_type_asym_pos_neg_upper_bounds.html")| row | Home-rule municipalities | Non-home-rule municipalities | Other | Townships | Schools |
|---|---|---|---|---|---|
| No controls - Positive EAV change | 0.002 | 0.056 | 0.089 | 0.041 | 0.105 |
| No controls - Negative EAV change | 0.079 | 0.325 | 0.276 | 0.344 | 0.194 |
| Year FE - Positive EAV change | 0.040 | -0.027 | 0.091 | 0.072 | 0.041 |
| Year FE - Negative EAV change | 0.209 | 0.178 | 0.332 | 0.218 | 0.088 |
| Year + unit FE - Positive EAV change | 0.041 | -0.028 | 0.092 | 0.071 | 0.040 |
| Year + unit FE - Negative EAV change | 0.215 | 0.197 | 0.334 | 0.220 | 0.086 |
| IG revenue + year + unit FE - Positive EAV change | 0.057 | 0.490 | NA | NA | 0.043 |
| IG revenue + year + unit FE - Negative EAV change | 0.274 | 0.147 | NA | NA | 0.092 |
| Same sample as IG row, no IG control - Positive EAV change | 0.058 | 0.442 | NA | NA | 0.042 |
| Same sample as IG row, no IG control - Negative EAV change | 0.273 | 0.131 | NA | NA | 0.090 |
| Enrollment + year + unit FE - Positive EAV change | NA | NA | NA | NA | 0.037 |
| Enrollment + year + unit FE - Negative EAV change | NA | NA | NA | NA | 0.090 |
include_table("v22_table_09_B_IV_by_type_asym_pos_neg_upper_bounds_long.html")| row | agency | component | N | estimate | std_error | p_value | upper_bound | F_neg | F_pos | SW_F_neg | SW_F_pos | p_exog | p_equal |
|---|---|---|---|---|---|---|---|---|---|---|---|---|---|
| No controls | Home-rule municipalities | Positive EAV change | 1001 | -0.047 | 0.030 | 0.123 | 0.002 | 1581.1 | 558.4 | 566.5 | 667.8 | 0.010 | 0.904 |
| No controls | Home-rule municipalities | Negative EAV change | 1001 | -0.060 | 0.084 | 0.480 | 0.079 | 1581.1 | 558.4 | 566.5 | 667.8 | 0.010 | 0.904 |
| No controls | Non-home-rule municipalities | Positive EAV change | 571 | -0.003 | 0.036 | 0.944 | 0.056 | 823.7 | 1008.6 | 625.4 | 1150.3 | 0.760 | 0.236 |
| No controls | Non-home-rule municipalities | Negative EAV change | 571 | 0.156 | 0.103 | 0.137 | 0.325 | 823.7 | 1008.6 | 625.4 | 1150.3 | 0.760 | 0.236 |
| No controls | Other | Positive EAV change | 2145 | -0.029 | 0.072 | 0.687 | 0.089 | 2998.9 | 1073.9 | 1130.5 | 1282.1 | 0.377 | 0.050 |
| No controls | Other | Negative EAV change | 2145 | 0.159** | 0.071 | 0.027 | 0.276 | 2998.9 | 1073.9 | 1130.5 | 1282.1 | 0.377 | 0.050 |
| No controls | Townships | Positive EAV change | 420 | -0.031 | 0.044 | 0.484 | 0.041 | 979.0 | 1099.4 | 582.6 | 794.5 | 0.172 | 0.160 |
| No controls | Townships | Negative EAV change | 420 | 0.168 | 0.107 | 0.126 | 0.344 | 979.0 | 1099.4 | 582.6 | 794.5 | 0.172 | 0.160 |
| No controls | Schools | Positive EAV change | 1995 | 0.072*** | 0.020 | 0.000 | 0.105 | 2869.6 | 1631.7 | 1425.6 | 1536.0 | 0.339 | 0.316 |
| No controls | Schools | Negative EAV change | 1995 | 0.128*** | 0.040 | 0.002 | 0.194 | 2869.6 | 1631.7 | 1425.6 | 1536.0 | 0.339 | 0.316 |
| Year FE | Home-rule municipalities | Positive EAV change | 1001 | -0.013 | 0.032 | 0.688 | 0.040 | 202.1 | 404.2 | 325.9 | 809.3 | 0.398 | 0.707 |
| Year FE | Home-rule municipalities | Negative EAV change | 1001 | 0.034 | 0.107 | 0.754 | 0.209 | 202.1 | 404.2 | 325.9 | 809.3 | 0.398 | 0.707 |
| Year FE | Non-home-rule municipalities | Positive EAV change | 571 | -0.085** | 0.035 | 0.021 | -0.027 | 125.6 | 1162.2 | 211.8 | 1768.2 | 0.154 | 0.786 |
| Year FE | Non-home-rule municipalities | Negative EAV change | 571 | -0.143 | 0.195 | 0.470 | 0.178 | 125.6 | 1162.2 | 211.8 | 1768.2 | 0.154 | 0.786 |
| Year FE | Other | Positive EAV change | 2145 | -0.113 | 0.124 | 0.364 | 0.091 | 373.0 | 918.5 | 657.2 | 1676.2 | 0.289 | 0.141 |
| Year FE | Other | Negative EAV change | 2145 | 0.148 | 0.112 | 0.189 | 0.332 | 373.0 | 918.5 | 657.2 | 1676.2 | 0.289 | 0.141 |
| Year FE | Townships | Positive EAV change | 420 | -0.021 | 0.056 | 0.709 | 0.072 | 113.4 | 649.4 | 231.4 | 1301.0 | 0.237 | 0.230 |
| Year FE | Townships | Negative EAV change | 420 | 0.106 | 0.068 | 0.130 | 0.218 | 113.4 | 649.4 | 231.4 | 1301.0 | 0.237 | 0.230 |
| Year FE | Schools | Positive EAV change | 1995 | 0.010 | 0.019 | 0.615 | 0.041 | 346.1 | 725.5 | 599.2 | 1447.1 | 0.001 | 0.936 |
| Year FE | Schools | Negative EAV change | 1995 | 0.005 | 0.050 | 0.920 | 0.088 | 346.1 | 725.5 | 599.2 | 1447.1 | 0.001 | 0.936 |
| Year + unit FE | Home-rule municipalities | Positive EAV change | 1001 | -0.012 | 0.032 | 0.710 | 0.041 | 199.9 | 400.6 | 322.9 | 806.3 | 0.410 | 0.687 |
| Year + unit FE | Home-rule municipalities | Negative EAV change | 1001 | 0.038 | 0.108 | 0.724 | 0.215 | 199.9 | 400.6 | 322.9 | 806.3 | 0.410 | 0.687 |
| Year + unit FE | Non-home-rule municipalities | Positive EAV change | 571 | -0.086** | 0.036 | 0.020 | -0.028 | 119.3 | 1176.6 | 188.7 | 1765.3 | 0.238 | 0.834 |
| Year + unit FE | Non-home-rule municipalities | Negative EAV change | 571 | -0.132 | 0.200 | 0.513 | 0.197 | 119.3 | 1176.6 | 188.7 | 1765.3 | 0.238 | 0.834 |
| Year + unit FE | Other | Positive EAV change | 2143 | -0.113 | 0.124 | 0.366 | 0.092 | 370.6 | 910.9 | 657.5 | 1668.5 | 0.356 | 0.140 |
| Year + unit FE | Other | Negative EAV change | 2143 | 0.149 | 0.112 | 0.185 | 0.334 | 370.6 | 910.9 | 657.5 | 1668.5 | 0.356 | 0.140 |
| Year + unit FE | Townships | Positive EAV change | 420 | -0.021 | 0.056 | 0.710 | 0.071 | 112.3 | 650.6 | 231.2 | 1311.5 | 0.179 | 0.233 |
| Year + unit FE | Townships | Negative EAV change | 420 | 0.107 | 0.069 | 0.134 | 0.220 | 112.3 | 650.6 | 231.2 | 1311.5 | 0.179 | 0.233 |
| Year + unit FE | Schools | Positive EAV change | 1995 | 0.009 | 0.019 | 0.640 | 0.040 | 342.7 | 722.3 | 593.0 | 1444.6 | 0.005 | 0.924 |
| Year + unit FE | Schools | Negative EAV change | 1995 | 0.004 | 0.050 | 0.942 | 0.086 | 342.7 | 722.3 | 593.0 | 1444.6 | 0.005 | 0.924 |
| IG revenue + year + unit FE | Home-rule municipalities | Positive EAV change | 479 | -0.064 | 0.074 | 0.387 | 0.057 | 92.4 | 116.8 | 223.0 | 229.3 | 0.063 | 0.096 |
| IG revenue + year + unit FE | Home-rule municipalities | Negative EAV change | 479 | 0.144* | 0.079 | 0.076 | 0.274 | 92.4 | 116.8 | 223.0 | 229.3 | 0.063 | 0.096 |
| IG revenue + year + unit FE | Non-home-rule municipalities | Positive EAV change | 98 | 0.299** | 0.116 | 0.019 | 0.490 | 121.3 | 15.2 | 292.0 | 36.3 | 0.876 | 0.042 |
| IG revenue + year + unit FE | Non-home-rule municipalities | Negative EAV change | 98 | -0.039 | 0.113 | 0.735 | 0.147 | 121.3 | 15.2 | 292.0 | 36.3 | 0.876 | 0.042 |
| IG revenue + year + unit FE | Schools | Positive EAV change | 1722 | -0.012 | 0.033 | 0.723 | 0.043 | 287.7 | 367.8 | 604.1 | 769.4 | 0.004 | 0.745 |
| IG revenue + year + unit FE | Schools | Negative EAV change | 1722 | 0.009 | 0.050 | 0.866 | 0.092 | 287.7 | 367.8 | 604.1 | 769.4 | 0.004 | 0.745 |
| Same sample as IG row, no IG control | Home-rule municipalities | Positive EAV change | 479 | -0.065 | 0.075 | 0.387 | 0.058 | 93.2 | 116.7 | 223.5 | 228.6 | 0.064 | 0.098 |
| Same sample as IG row, no IG control | Home-rule municipalities | Negative EAV change | 479 | 0.142* | 0.080 | 0.080 | 0.273 | 93.2 | 116.7 | 223.5 | 228.6 | 0.064 | 0.098 |
| Same sample as IG row, no IG control | Non-home-rule municipalities | Positive EAV change | 98 | 0.270** | 0.105 | 0.018 | 0.442 | 150.3 | 16.4 | 311.6 | 38.2 | 0.884 | 0.051 |
| Same sample as IG row, no IG control | Non-home-rule municipalities | Negative EAV change | 98 | -0.047 | 0.108 | 0.668 | 0.131 | 150.3 | 16.4 | 311.6 | 38.2 | 0.884 | 0.051 |
| Same sample as IG row, no IG control | Schools | Positive EAV change | 1722 | -0.012 | 0.033 | 0.713 | 0.042 | 288.8 | 366.9 | 606.0 | 772.5 | 0.004 | 0.769 |
| Same sample as IG row, no IG control | Schools | Negative EAV change | 1722 | 0.006 | 0.051 | 0.905 | 0.090 | 288.8 | 366.9 | 606.0 | 772.5 | 0.004 | 0.769 |
| Enrollment + year + unit FE | Schools | Positive EAV change | 1722 | -0.016 | 0.032 | 0.614 | 0.037 | 287.5 | 368.6 | 609.4 | 774.4 | 0.003 | 0.717 |
| Enrollment + year + unit FE | Schools | Negative EAV change | 1722 | 0.006 | 0.051 | 0.903 | 0.090 | 287.5 | 368.6 | 609.4 | 774.4 | 0.003 | 0.717 |
include_table("v22_table_09_C_IV_by_type_asym_first_stage_long.html")| row | agency | N | F_neg | F_pos | SW_F_neg | SW_F_pos | p_exog |
|---|---|---|---|---|---|---|---|
| No controls | Home-rule municipalities | 1001 | 1581.1 | 558.4 | 566.5 | 667.8 | 0.010 |
| No controls | Non-home-rule municipalities | 571 | 823.7 | 1008.6 | 625.4 | 1150.3 | 0.760 |
| No controls | Other | 2145 | 2998.9 | 1073.9 | 1130.5 | 1282.1 | 0.377 |
| No controls | Townships | 420 | 979.0 | 1099.4 | 582.6 | 794.5 | 0.172 |
| No controls | Schools | 1995 | 2869.6 | 1631.7 | 1425.6 | 1536.0 | 0.339 |
| Year FE | Home-rule municipalities | 1001 | 202.1 | 404.2 | 325.9 | 809.3 | 0.398 |
| Year FE | Non-home-rule municipalities | 571 | 125.6 | 1162.2 | 211.8 | 1768.2 | 0.154 |
| Year FE | Other | 2145 | 373.0 | 918.5 | 657.2 | 1676.2 | 0.289 |
| Year FE | Townships | 420 | 113.4 | 649.4 | 231.4 | 1301.0 | 0.237 |
| Year FE | Schools | 1995 | 346.1 | 725.5 | 599.2 | 1447.1 | 0.001 |
| Year + unit FE | Home-rule municipalities | 1001 | 199.9 | 400.6 | 322.9 | 806.3 | 0.410 |
| Year + unit FE | Non-home-rule municipalities | 571 | 119.3 | 1176.6 | 188.7 | 1765.3 | 0.238 |
| Year + unit FE | Other | 2143 | 370.6 | 910.9 | 657.5 | 1668.5 | 0.356 |
| Year + unit FE | Townships | 420 | 112.3 | 650.6 | 231.2 | 1311.5 | 0.179 |
| Year + unit FE | Schools | 1995 | 342.7 | 722.3 | 593.0 | 1444.6 | 0.005 |
| IG revenue + year + unit FE | Home-rule municipalities | 479 | 92.4 | 116.8 | 223.0 | 229.3 | 0.063 |
| IG revenue + year + unit FE | Non-home-rule municipalities | 98 | 121.3 | 15.2 | 292.0 | 36.3 | 0.876 |
| IG revenue + year + unit FE | Schools | 1722 | 287.7 | 367.8 | 604.1 | 769.4 | 0.004 |
| Same sample as IG row, no IG control | Home-rule municipalities | 479 | 93.2 | 116.7 | 223.5 | 228.6 | 0.064 |
| Same sample as IG row, no IG control | Non-home-rule municipalities | 98 | 150.3 | 16.4 | 311.6 | 38.2 | 0.884 |
| Same sample as IG row, no IG control | Schools | 1722 | 288.8 | 366.9 | 606.0 | 772.5 | 0.004 |
| Enrollment + year + unit FE | Schools | 1722 | 287.5 | 368.6 | 609.4 | 774.4 | 0.003 |
include_table("v22_table_09_D_IV_by_type_asym_alt_neg_instrument_long.html")| row | agency | component | N | estimate | std_error | p_value | upper_bound | F_neg | F_pos | SW_F_neg | SW_F_pos | p_exog | p_equal |
|---|---|---|---|---|---|---|---|---|---|---|---|---|---|
| No controls | Home-rule municipalities | Positive EAV change | 1001 | -0.030 | 0.038 | 0.426 | 0.032 | 420.9 | 298.4 | 899.3 | 680.1 | 0.643 | 0.078 |
| No controls | Home-rule municipalities | Negative EAV change | 1001 | 0.076* | 0.040 | 0.063 | 0.141 | 420.9 | 298.4 | 899.3 | 680.1 | 0.643 | 0.078 |
| No controls | Non-home-rule municipalities | Positive EAV change | 571 | 0.011 | 0.041 | 0.795 | 0.078 | 394.5 | 466.3 | 998.3 | 1255.5 | 0.109 | 0.104 |
| No controls | Non-home-rule municipalities | Negative EAV change | 571 | 0.247* | 0.128 | 0.060 | 0.457 | 394.5 | 466.3 | 998.3 | 1255.5 | 0.109 | 0.104 |
| No controls | Other | Positive EAV change | 2145 | -0.021 | 0.059 | 0.723 | 0.076 | 719.6 | 655.6 | 1574.9 | 1555.6 | 0.131 | 0.150 |
| No controls | Other | Negative EAV change | 2145 | 0.230* | 0.119 | 0.056 | 0.426 | 719.6 | 655.6 | 1574.9 | 1555.6 | 0.131 | 0.150 |
| No controls | Townships | Positive EAV change | 420 | -0.053 | 0.054 | 0.330 | 0.035 | 548.1 | 523.5 | 1268.5 | 1375.3 | 0.119 | 0.686 |
| No controls | Townships | Negative EAV change | 420 | -0.016 | 0.078 | 0.839 | 0.112 | 548.1 | 523.5 | 1268.5 | 1375.3 | 0.119 | 0.686 |
| No controls | Schools | Positive EAV change | 1995 | 0.066*** | 0.022 | 0.003 | 0.102 | 989.0 | 729.9 | 2243.2 | 1714.7 | 0.268 | 0.818 |
| No controls | Schools | Negative EAV change | 1995 | 0.075*** | 0.025 | 0.003 | 0.116 | 989.0 | 729.9 | 2243.2 | 1714.7 | 0.268 | 0.818 |
| Year FE | Home-rule municipalities | Positive EAV change | 1001 | -0.013 | 0.032 | 0.688 | 0.040 | 202.1 | 404.2 | 325.9 | 809.3 | 0.398 | 0.707 |
| Year FE | Home-rule municipalities | Negative EAV change | 1001 | 0.034 | 0.107 | 0.754 | 0.209 | 202.1 | 404.2 | 325.9 | 809.3 | 0.398 | 0.707 |
| Year FE | Non-home-rule municipalities | Positive EAV change | 571 | -0.085** | 0.035 | 0.021 | -0.027 | 125.6 | 1162.2 | 211.8 | 1768.2 | 0.154 | 0.786 |
| Year FE | Non-home-rule municipalities | Negative EAV change | 571 | -0.143 | 0.195 | 0.470 | 0.178 | 125.6 | 1162.2 | 211.8 | 1768.2 | 0.154 | 0.786 |
| Year FE | Other | Positive EAV change | 2145 | -0.113 | 0.124 | 0.364 | 0.091 | 373.0 | 918.5 | 657.2 | 1676.2 | 0.289 | 0.141 |
| Year FE | Other | Negative EAV change | 2145 | 0.148 | 0.112 | 0.189 | 0.332 | 373.0 | 918.5 | 657.2 | 1676.2 | 0.289 | 0.141 |
| Year FE | Townships | Positive EAV change | 420 | -0.021 | 0.056 | 0.709 | 0.072 | 113.4 | 649.4 | 231.4 | 1301.0 | 0.237 | 0.230 |
| Year FE | Townships | Negative EAV change | 420 | 0.106 | 0.068 | 0.130 | 0.218 | 113.4 | 649.4 | 231.4 | 1301.0 | 0.237 | 0.230 |
| Year FE | Schools | Positive EAV change | 1995 | 0.010 | 0.019 | 0.615 | 0.041 | 346.1 | 725.5 | 599.2 | 1447.1 | 0.001 | 0.936 |
| Year FE | Schools | Negative EAV change | 1995 | 0.005 | 0.050 | 0.920 | 0.088 | 346.1 | 725.5 | 599.2 | 1447.1 | 0.001 | 0.936 |
| Year + unit FE | Home-rule municipalities | Positive EAV change | 1001 | -0.012 | 0.032 | 0.710 | 0.041 | 199.9 | 400.6 | 322.9 | 806.3 | 0.410 | 0.687 |
| Year + unit FE | Home-rule municipalities | Negative EAV change | 1001 | 0.038 | 0.108 | 0.724 | 0.215 | 199.9 | 400.6 | 322.9 | 806.3 | 0.410 | 0.687 |
| Year + unit FE | Non-home-rule municipalities | Positive EAV change | 571 | -0.086** | 0.036 | 0.020 | -0.028 | 119.3 | 1176.6 | 188.7 | 1765.3 | 0.238 | 0.834 |
| Year + unit FE | Non-home-rule municipalities | Negative EAV change | 571 | -0.132 | 0.200 | 0.513 | 0.197 | 119.3 | 1176.6 | 188.7 | 1765.3 | 0.238 | 0.834 |
| Year + unit FE | Other | Positive EAV change | 2143 | -0.113 | 0.124 | 0.366 | 0.092 | 370.6 | 910.9 | 657.5 | 1668.5 | 0.356 | 0.140 |
| Year + unit FE | Other | Negative EAV change | 2143 | 0.149 | 0.112 | 0.185 | 0.334 | 370.6 | 910.9 | 657.5 | 1668.5 | 0.356 | 0.140 |
| Year + unit FE | Townships | Positive EAV change | 420 | -0.021 | 0.056 | 0.710 | 0.071 | 112.3 | 650.6 | 231.2 | 1311.5 | 0.179 | 0.233 |
| Year + unit FE | Townships | Negative EAV change | 420 | 0.107 | 0.069 | 0.134 | 0.220 | 112.3 | 650.6 | 231.2 | 1311.5 | 0.179 | 0.233 |
| Year + unit FE | Schools | Positive EAV change | 1995 | 0.009 | 0.019 | 0.640 | 0.040 | 342.7 | 722.3 | 593.0 | 1444.6 | 0.005 | 0.924 |
| Year + unit FE | Schools | Negative EAV change | 1995 | 0.004 | 0.050 | 0.942 | 0.086 | 342.7 | 722.3 | 593.0 | 1444.6 | 0.005 | 0.924 |
| IG revenue + year + unit FE | Home-rule municipalities | Positive EAV change | 479 | -0.064 | 0.074 | 0.387 | 0.057 | 92.4 | 116.8 | 223.0 | 229.3 | 0.063 | 0.096 |
| IG revenue + year + unit FE | Home-rule municipalities | Negative EAV change | 479 | 0.144* | 0.079 | 0.076 | 0.274 | 92.4 | 116.8 | 223.0 | 229.3 | 0.063 | 0.096 |
| IG revenue + year + unit FE | Non-home-rule municipalities | Positive EAV change | 98 | 0.299** | 0.116 | 0.019 | 0.490 | 121.3 | 15.2 | 292.0 | 36.3 | 0.876 | 0.042 |
| IG revenue + year + unit FE | Non-home-rule municipalities | Negative EAV change | 98 | -0.039 | 0.113 | 0.735 | 0.147 | 121.3 | 15.2 | 292.0 | 36.3 | 0.876 | 0.042 |
| IG revenue + year + unit FE | Schools | Positive EAV change | 1722 | -0.012 | 0.033 | 0.723 | 0.043 | 287.7 | 367.8 | 604.1 | 769.4 | 0.004 | 0.745 |
| IG revenue + year + unit FE | Schools | Negative EAV change | 1722 | 0.009 | 0.050 | 0.866 | 0.092 | 287.7 | 367.8 | 604.1 | 769.4 | 0.004 | 0.745 |
| Same sample as IG row, no IG control | Home-rule municipalities | Positive EAV change | 479 | -0.065 | 0.075 | 0.387 | 0.058 | 93.2 | 116.7 | 223.5 | 228.6 | 0.064 | 0.098 |
| Same sample as IG row, no IG control | Home-rule municipalities | Negative EAV change | 479 | 0.142* | 0.080 | 0.080 | 0.273 | 93.2 | 116.7 | 223.5 | 228.6 | 0.064 | 0.098 |
| Same sample as IG row, no IG control | Non-home-rule municipalities | Positive EAV change | 98 | 0.270** | 0.105 | 0.018 | 0.442 | 150.3 | 16.4 | 311.6 | 38.2 | 0.884 | 0.051 |
| Same sample as IG row, no IG control | Non-home-rule municipalities | Negative EAV change | 98 | -0.047 | 0.108 | 0.668 | 0.131 | 150.3 | 16.4 | 311.6 | 38.2 | 0.884 | 0.051 |
| Same sample as IG row, no IG control | Schools | Positive EAV change | 1722 | -0.012 | 0.033 | 0.713 | 0.042 | 288.8 | 366.9 | 606.0 | 772.5 | 0.004 | 0.769 |
| Same sample as IG row, no IG control | Schools | Negative EAV change | 1722 | 0.006 | 0.051 | 0.905 | 0.090 | 288.8 | 366.9 | 606.0 | 772.5 | 0.004 | 0.769 |
| Enrollment + year + unit FE | Schools | Positive EAV change | 1722 | -0.016 | 0.032 | 0.614 | 0.037 | 287.5 | 368.6 | 609.4 | 774.4 | 0.003 | 0.717 |
| Enrollment + year + unit FE | Schools | Negative EAV change | 1722 | 0.006 | 0.051 | 0.903 | 0.090 | 287.5 | 368.6 | 609.4 | 774.4 | 0.003 | 0.717 |
include_table("v22_table_10_OLS_all_agencies_lagged.html")| M1 | M2 | M3 | |
|---|---|---|---|
| * p < 0.1, ** p < 0.05, *** p < 0.01 | |||
| Standard errors are clustered by taxing agency. | |||
| p_lags tests whether the sum of the two lag coefficients equals zero. | |||
| joint_lag_F and joint_lag_p test whether both lag coefficients jointly equal zero. | |||
| upper_bound is computed for the cumulative sum of current and lagged EAV coefficients. | |||
| Current EAV change | 0.077*** | 0.120*** | 0.099*** |
| (0.011) | (0.034) | (0.033) | |
| Lag 1 EAV change | −0.037 | 0.048 | 0.024 |
| (0.031) | (0.031) | (0.034) | |
| Lag 2 EAV change | 0.080** | 0.135** | 0.115 |
| (0.037) | (0.067) | (0.072) | |
| N | 6132 | 6132 | 6130 |
| p_lags | 0.002 | 0.031 | 0.141 |
| joint_lag_F | 4.9 | 2.3 | 1.3 |
| joint_lag_p | 0.007 | 0.097 | 0.271 |
| upper_bound | 0.152 | 0.489 | 0.437 |
include_table("v22_table_10_OLS_all_agencies_lagged_sums.html")| model | N | lagged_magnitude | std_error | lagged_p | joint_lag_F | joint_lag_p | A_upper_bound |
|---|---|---|---|---|---|---|---|
| M1 | 6132 | 0.120*** | 0.019 | 0.000 | 4.9 | 0.007 | 0.152 |
| M2 | 6132 | 0.304*** | 0.113 | 0.007 | 2.3 | 0.097 | 0.489 |
| M3 | 6130 | 0.238** | 0.121 | 0.049 | 1.3 | 0.271 | 0.437 |
include_table("v22_table_11_OLS_by_type_lagged_upper_bounds.html")| row | Home-rule municipalities | Non-home-rule municipalities | Other | Townships | Schools |
|---|---|---|---|---|---|
| No controls | 0.138 | 0.136 | 0.241 | 0.095 | 0.149 |
| Year FE | 0.413 | 0.447 | 0.793 | 0.197 | 0.478 |
| Year + unit FE | 0.422 | 0.392 | 0.739 | 0.280 | 0.385 |
| IG revenue + year + unit FE | 0.833 | 0.441 | NA | NA | 0.438 |
| Same sample as IG row, no IG control | 0.832 | 0.380 | NA | NA | 0.436 |
| Enrollment + year + unit FE | NA | NA | NA | NA | 0.433 |
include_table("v22_table_11_OLS_by_type_lagged_upper_bounds_long.html")| row | agency | N | lagged_magnitude | std_error | lagged_p | joint_lag_F | joint_lag_p | A_upper_bound |
|---|---|---|---|---|---|---|---|---|
| No controls | Home-rule municipalities | 1001 | 0.073* | 0.039 | 0.067 | 3.1 | 0.044 | 0.138 |
| No controls | Non-home-rule municipalities | 571 | 0.065 | 0.043 | 0.146 | 4.8 | 0.008 | 0.136 |
| No controls | Other | 2145 | 0.171*** | 0.043 | 0.000 | 2.1 | 0.126 | 0.241 |
| No controls | Townships | 420 | 0.054** | 0.025 | 0.040 | 5.4 | 0.005 | 0.095 |
| No controls | Schools | 1995 | 0.114*** | 0.021 | 0.000 | 4.9 | 0.008 | 0.149 |
| Year FE | Home-rule municipalities | 1001 | 0.110 | 0.184 | 0.554 | 0.1 | 0.948 | 0.413 |
| Year FE | Non-home-rule municipalities | 571 | 0.233* | 0.130 | 0.080 | 3.7 | 0.026 | 0.447 |
| Year FE | Other | 2145 | 0.391 | 0.244 | 0.111 | 0.9 | 0.408 | 0.793 |
| Year FE | Townships | 420 | 0.036 | 0.098 | 0.712 | 0.7 | 0.518 | 0.197 |
| Year FE | Schools | 1995 | 0.343*** | 0.082 | 0.000 | 12.0 | 0.000 | 0.478 |
| Year + unit FE | Home-rule municipalities | 1001 | 0.146 | 0.168 | 0.385 | 0.3 | 0.730 | 0.422 |
| Year + unit FE | Non-home-rule municipalities | 571 | 0.161 | 0.140 | 0.259 | 2.8 | 0.061 | 0.392 |
| Year + unit FE | Other | 2143 | 0.300 | 0.267 | 0.262 | 0.8 | 0.447 | 0.739 |
| Year + unit FE | Townships | 420 | 0.070 | 0.127 | 0.585 | 0.7 | 0.489 | 0.280 |
| Year + unit FE | Schools | 1995 | 0.257*** | 0.078 | 0.001 | 5.4 | 0.005 | 0.385 |
| IG revenue + year + unit FE | Home-rule municipalities | 479 | 0.361 | 0.287 | 0.214 | 0.3 | 0.765 | 0.833 |
| IG revenue + year + unit FE | Non-home-rule municipalities | 98 | 0.098 | 0.208 | 0.643 | 0.0 | 0.962 | 0.441 |
| IG revenue + year + unit FE | Schools | 1722 | 0.280*** | 0.096 | 0.004 | 3.8 | 0.023 | 0.438 |
| Same sample as IG row, no IG control | Home-rule municipalities | 479 | 0.360 | 0.287 | 0.214 | 0.3 | 0.759 | 0.832 |
| Same sample as IG row, no IG control | Non-home-rule municipalities | 98 | 0.075 | 0.185 | 0.688 | 0.1 | 0.939 | 0.380 |
| Same sample as IG row, no IG control | Schools | 1722 | 0.278*** | 0.096 | 0.005 | 3.7 | 0.025 | 0.436 |
| Enrollment + year + unit FE | Schools | 1722 | 0.278*** | 0.095 | 0.004 | 4.0 | 0.019 | 0.433 |
The excluded variable F-test (often called the first-stage F-test) in an Instrumental Variable (IV) model is a diagnostic test used to check the strength of your instruments. It determines if your excluded instruments are sufficiently correlated with the endogenous explanatory variables to avoid weak instrument bias
Interpreting the Test:
The Null Hypothesis ((H_{0})): The excluded instruments are irrelevant (i.e., they do not jointly predict the endogenous variable in the first stage).
Rule of Thumb: A standard rule of thumb is that the F-statistic should be greater than 10. If the F-test yields a value below 10, it generally indicates weak instruments, meaning your IV estimates may be biased and standard errors may be unreliable.
Modern Standards: Modern econometric guidance (such as Lee et al., 2022) suggests targeting higher F-statistics (e.g., >104.7) to guarantee robustness at a 5% significance level.
include_table("instrument_validity_checks.html")| All agencies | All Munis | HR Munis | Non-HR Munis | Other | Schools | Townships | |
|---|---|---|---|---|---|---|---|
| * p < 0.1, ** p < 0.05, *** p < 0.01 | |||||||
| Standard errors are clustered by taxing agency. | |||||||
| The excluded-instrument F statistic tests whether reassessment year predicts the change in EAV. | |||||||
| Reassessment year | 6.719*** | 6.587*** | 6.646*** | 5.833*** | 6.726*** | 6.824*** | 6.900*** |
| (0.138) | (0.283) | (0.349) | (1.192) | (0.254) | (0.239) | (0.199) | |
| Num.Obs. | 6133 | 1575 | 1002 | 573 | 2143 | 1995 | 420 |
| R2 | 0.688 | 0.709 | 0.673 | 0.817 | 0.659 | 0.697 | 0.734 |
| R2 Within | 0.141 | 0.135 | 0.140 | 0.082 | 0.130 | 0.151 | 0.205 |
| FE: n_uniqueid | X | X | X | X | X | X | X |
| FE: year | X | X | X | X | X | X | |
| FE: year^home_rule_ind | X | ||||||
| Excluded-instrument F | 2367.7 | 540.5 | 362.2 | 24.0 | 698.9 | 816.4 | 1202.9 |
| Year-by-home-rule FE | Yes | No | No | No | No | No | No |
| Year FE | Yes | Yes | Yes | Yes | Yes | Yes | Yes |
| Agency FE | Yes | Yes | Yes | Yes | Yes | Yes | Yes |
include_table("v22_table_A2_OLS_by_type_point_estimates_wide.html")| row | Home-rule municipalities | Non-home-rule municipalities | Schools | Townships | Other |
|---|---|---|---|---|---|
| No controls | 0.015 | 0.039* | 0.096*** | 0.009 | 0.093*** |
| Year FE | 0.077 | -0.034 | 0.114** | 0.018 | 0.109** |
| Year + unit FE | 0.071 | -0.051 | 0.102** | 0.018 | 0.085** |
| IG revenue + year + unit FE | 0.229* | 0.127 | 0.157** | NA | NA |
| Same sample as IG row, no IG control | 0.229* | 0.117 | 0.156** | NA | NA |
| Enrollment + year + unit FE | NA | NA | 0.155** | NA | NA |
include_table("v22_table_A2_OLS_by_type_point_estimates.html")| row | agency | N | estimate | std_error | p_value |
|---|---|---|---|---|---|
| No controls | Home-rule municipalities | 1001 | 0.015 | 0.026 | 0.578 |
| No controls | Non-home-rule municipalities | 571 | 0.039* | 0.022 | 0.087 |
| No controls | Other | 2145 | 0.093*** | 0.018 | 0.000 |
| No controls | Townships | 420 | 0.009 | 0.027 | 0.737 |
| No controls | Schools | 1995 | 0.096*** | 0.018 | 0.000 |
| Year FE | Home-rule municipalities | 1001 | 0.077 | 0.052 | 0.148 |
| Year FE | Non-home-rule municipalities | 571 | -0.034 | 0.048 | 0.484 |
| Year FE | Other | 2145 | 0.109** | 0.044 | 0.014 |
| Year FE | Townships | 420 | 0.018 | 0.027 | 0.502 |
| Year FE | Schools | 1995 | 0.114** | 0.044 | 0.010 |
| Year + unit FE | Home-rule municipalities | 1001 | 0.071 | 0.048 | 0.140 |
| Year + unit FE | Non-home-rule municipalities | 571 | -0.051 | 0.047 | 0.286 |
| Year + unit FE | Other | 2143 | 0.085** | 0.036 | 0.021 |
| Year + unit FE | Townships | 420 | 0.018 | 0.028 | 0.509 |
| Year + unit FE | Schools | 1995 | 0.102** | 0.040 | 0.011 |
| IG revenue + year + unit FE | Home-rule municipalities | 479 | 0.229* | 0.119 | 0.059 |
| IG revenue + year + unit FE | Non-home-rule municipalities | 98 | 0.127 | 0.137 | 0.365 |
| IG revenue + year + unit FE | Schools | 1722 | 0.157** | 0.066 | 0.019 |
| Same sample as IG row, no IG control | Home-rule municipalities | 479 | 0.229* | 0.118 | 0.057 |
| Same sample as IG row, no IG control | Non-home-rule municipalities | 98 | 0.117 | 0.127 | 0.371 |
| Same sample as IG row, no IG control | Schools | 1722 | 0.156** | 0.066 | 0.019 |
| Enrollment + year + unit FE | Schools | 1722 | 0.155** | 0.066 | 0.021 |
include_table("v22_table_A3_IV_by_type_point_estimates_wide.html")| row | Home-rule municipalities | Non-home-rule municipalities | Schools | Townships | Other |
|---|---|---|---|---|---|
| No controls | -0.045 | -0.029 | 0.065** | -0.058 | -0.052 |
| Year FE | -0.030 | -0.053 | 0.011 | -0.064 | -0.208 |
| Year + unit FE | -0.031 | -0.061 | 0.011 | -0.064 | -0.208 |
| IG revenue + year + unit FE | -0.514 | -0.108 | -0.037 | NA | NA |
| Same sample as IG row, no IG control | -0.514 | -0.109 | -0.035 | NA | NA |
| Enrollment + year + unit FE | NA | NA | -0.045 | NA | NA |
include_table("v22_table_A3_IV_by_type_point_estimates.html")| row | agency | N | estimate | std_error | p_value |
|---|---|---|---|---|---|
| No controls | Home-rule municipalities | 1001 | -0.045 | 0.044 | 0.311 |
| No controls | Non-home-rule municipalities | 571 | -0.029 | 0.055 | 0.597 |
| No controls | Other | 2145 | -0.052 | 0.080 | 0.515 |
| No controls | Townships | 420 | -0.058 | 0.061 | 0.350 |
| No controls | Schools | 1995 | 0.065** | 0.026 | 0.015 |
| Year FE | Home-rule municipalities | 1001 | -0.030 | 0.070 | 0.668 |
| Year FE | Non-home-rule municipalities | 571 | -0.053 | 0.134 | 0.694 |
| Year FE | Other | 2145 | -0.208 | 0.179 | 0.248 |
| Year FE | Townships | 420 | -0.064 | 0.088 | 0.473 |
| Year FE | Schools | 1995 | 0.011 | 0.033 | 0.734 |
| Year + unit FE | Home-rule municipalities | 1001 | -0.031 | 0.070 | 0.664 |
| Year + unit FE | Non-home-rule municipalities | 571 | -0.061 | 0.139 | 0.661 |
| Year + unit FE | Other | 2143 | -0.208 | 0.180 | 0.248 |
| Year + unit FE | Townships | 420 | -0.064 | 0.088 | 0.473 |
| Year + unit FE | Schools | 1995 | 0.011 | 0.033 | 0.742 |
| IG revenue + year + unit FE | Home-rule municipalities | 479 | -0.514 | 0.395 | 0.199 |
| IG revenue + year + unit FE | Non-home-rule municipalities | 98 | -0.108 | 0.212 | 0.616 |
| IG revenue + year + unit FE | Schools | 1722 | -0.037 | 0.100 | 0.714 |
| Same sample as IG row, no IG control | Home-rule municipalities | 479 | -0.514 | 0.396 | 0.200 |
| Same sample as IG row, no IG control | Non-home-rule municipalities | 98 | -0.109 | 0.205 | 0.601 |
| Same sample as IG row, no IG control | Schools | 1722 | -0.035 | 0.101 | 0.728 |
| Enrollment + year + unit FE | Schools | 1722 | -0.045 | 0.101 | 0.659 |
include_table("v22_table_A4_OLS_by_type_asym_p_equal.html")| row | agency | p_equal |
|---|---|---|
| No controls | Home-rule municipalities | 0.649 |
| No controls | Non-home-rule municipalities | 0.201 |
| No controls | Other | 0.813 |
| No controls | Townships | 0.815 |
| No controls | Schools | 0.392 |
| Year FE | Home-rule municipalities | 0.713 |
| Year FE | Non-home-rule municipalities | 0.170 |
| Year FE | Other | 0.803 |
| Year FE | Townships | 0.037 |
| Year FE | Schools | 0.334 |
| Year + unit FE | Home-rule municipalities | 0.937 |
| Year + unit FE | Non-home-rule municipalities | 0.132 |
| Year + unit FE | Other | 0.667 |
| Year + unit FE | Townships | 0.032 |
| Year + unit FE | Schools | 0.632 |
| IG revenue + year + unit FE | Home-rule municipalities | 0.320 |
| IG revenue + year + unit FE | Non-home-rule municipalities | 0.581 |
| IG revenue + year + unit FE | Schools | 0.594 |
| Same sample as IG row, no IG control | Home-rule municipalities | 0.319 |
| Same sample as IG row, no IG control | Non-home-rule municipalities | 0.587 |
| Same sample as IG row, no IG control | Schools | 0.585 |
| Enrollment + year + unit FE | Schools | 0.580 |
include_table("v22_table_A5_OLS_by_type_asym_point_estimates_wide.html")| row | Home-rule municipalities | Non-home-rule municipalities | Schools | Townships | Other |
|---|---|---|---|---|---|
| No controls | 0.004 | -0.007 | 0.111*** | 0.014 | 0.087*** |
| Year FE | 0.083 | 0.027 | 0.102* | -0.022 | 0.123* |
| Year + unit FE | 0.070 | 0.016 | 0.096* | -0.025 | 0.110 |
| IG revenue + year + unit FE | 0.293* | 0.195 | 0.175* | NA | NA |
| Same sample as IG row, no IG control | 0.293* | 0.182 | 0.175* | NA | NA |
| Enrollment + year + unit FE | NA | NA | 0.174* | NA | NA |
include_table("v22_table_A5_OLS_by_type_asym_point_estimates.html")| row | agency | N | estimate | std_error | p_value |
|---|---|---|---|---|---|
| No controls | Home-rule municipalities | 1001 | 0.004 | 0.046 | 0.932 |
| No controls | Non-home-rule municipalities | 571 | -0.007 | 0.022 | 0.763 |
| No controls | Other | 2145 | 0.087*** | 0.030 | 0.004 |
| No controls | Townships | 420 | 0.014 | 0.024 | 0.573 |
| No controls | Schools | 1995 | 0.111*** | 0.033 | 0.001 |
| Year FE | Home-rule municipalities | 1001 | 0.083 | 0.064 | 0.199 |
| Year FE | Non-home-rule municipalities | 571 | 0.027 | 0.054 | 0.625 |
| Year FE | Other | 2145 | 0.123* | 0.070 | 0.083 |
| Year FE | Townships | 420 | -0.022 | 0.037 | 0.555 |
| Year FE | Schools | 1995 | 0.102* | 0.054 | 0.059 |
| Year + unit FE | Home-rule municipalities | 1001 | 0.070 | 0.060 | 0.249 |
| Year + unit FE | Non-home-rule municipalities | 571 | 0.016 | 0.054 | 0.765 |
| Year + unit FE | Other | 2143 | 0.110 | 0.069 | 0.113 |
| Year + unit FE | Townships | 420 | -0.025 | 0.037 | 0.513 |
| Year + unit FE | Schools | 1995 | 0.096* | 0.049 | 0.053 |
| IG revenue + year + unit FE | Home-rule municipalities | 479 | 0.293* | 0.172 | 0.095 |
| IG revenue + year + unit FE | Non-home-rule municipalities | 98 | 0.195 | 0.192 | 0.322 |
| IG revenue + year + unit FE | Schools | 1722 | 0.175* | 0.095 | 0.067 |
| Same sample as IG row, no IG control | Home-rule municipalities | 479 | 0.293* | 0.171 | 0.093 |
| Same sample as IG row, no IG control | Non-home-rule municipalities | 98 | 0.182 | 0.188 | 0.345 |
| Same sample as IG row, no IG control | Schools | 1722 | 0.175* | 0.095 | 0.067 |
| Enrollment + year + unit FE | Schools | 1722 | 0.174* | 0.095 | 0.070 |
include_table("v22_table_A5_B_OLS_by_type_asym_point_estimates_pos_neg_wide.html")| row | Home-rule municipalities | Non-home-rule municipalities | Schools | Townships | Other |
|---|---|---|---|---|---|
| No controls - Positive EAV change | 0.004 | -0.007 | 0.111*** | 0.014 | 0.087*** |
| No controls - Negative EAV change | 0.036 | 0.126 | 0.067*** | 0.001 | 0.105* |
| Year FE - Positive EAV change | 0.083 | 0.027 | 0.102* | -0.022 | 0.123* |
| Year FE - Negative EAV change | 0.049 | -0.219 | 0.169*** | 0.218** | 0.063 |
| Year + unit FE - Positive EAV change | 0.070 | 0.016 | 0.096* | -0.025 | 0.110 |
| Year + unit FE - Negative EAV change | 0.077 | -0.264 | 0.131*** | 0.233** | 0.001 |
| IG revenue + year + unit FE - Positive EAV change | 0.293* | 0.195 | 0.175* | NA | NA |
| IG revenue + year + unit FE - Negative EAV change | 0.094 | 0.031 | 0.114** | NA | NA |
| Same sample as IG row, no IG control - Positive EAV change | 0.293* | 0.182 | 0.175* | NA | NA |
| Same sample as IG row, no IG control - Negative EAV change | 0.093 | 0.023 | 0.112** | NA | NA |
| Enrollment + year + unit FE - Positive EAV change | NA | NA | 0.174* | NA | NA |
| Enrollment + year + unit FE - Negative EAV change | NA | NA | 0.111** | NA | NA |
include_table("v22_table_A5_B_OLS_by_type_asym_point_estimates_pos_neg.html")| row | agency | component | N | estimate | std_error | p_value | upper_bound | p_equal |
|---|---|---|---|---|---|---|---|---|
| No controls | Home-rule municipalities | Positive EAV change | 1001 | 0.004 | 0.046 | 0.932 | 0.080 | 0.649 |
| No controls | Home-rule municipalities | Negative EAV change | 1001 | 0.036 | 0.033 | 0.289 | 0.090 | 0.649 |
| No controls | Non-home-rule municipalities | Positive EAV change | 571 | -0.007 | 0.022 | 0.763 | 0.030 | 0.201 |
| No controls | Non-home-rule municipalities | Negative EAV change | 571 | 0.126 | 0.086 | 0.149 | 0.267 | 0.201 |
| No controls | Other | Positive EAV change | 2145 | 0.087*** | 0.030 | 0.004 | 0.135 | 0.813 |
| No controls | Other | Negative EAV change | 2145 | 0.105* | 0.055 | 0.061 | 0.196 | 0.813 |
| No controls | Townships | Positive EAV change | 420 | 0.014 | 0.024 | 0.573 | 0.053 | 0.815 |
| No controls | Townships | Negative EAV change | 420 | 0.001 | 0.055 | 0.990 | 0.091 | 0.815 |
| No controls | Schools | Positive EAV change | 1995 | 0.111*** | 0.033 | 0.001 | 0.165 | 0.392 |
| No controls | Schools | Negative EAV change | 1995 | 0.067*** | 0.023 | 0.004 | 0.105 | 0.392 |
| Year FE | Home-rule municipalities | Positive EAV change | 1001 | 0.083 | 0.064 | 0.199 | 0.188 | 0.713 |
| Year FE | Home-rule municipalities | Negative EAV change | 1001 | 0.049 | 0.063 | 0.438 | 0.152 | 0.713 |
| Year FE | Non-home-rule municipalities | Positive EAV change | 571 | 0.027 | 0.054 | 0.625 | 0.116 | 0.170 |
| Year FE | Non-home-rule municipalities | Negative EAV change | 571 | -0.219 | 0.159 | 0.175 | 0.042 | 0.170 |
| Year FE | Other | Positive EAV change | 2145 | 0.123* | 0.070 | 0.083 | 0.238 | 0.803 |
| Year FE | Other | Negative EAV change | 2145 | 0.063 | 0.192 | 0.745 | 0.378 | 0.803 |
| Year FE | Townships | Positive EAV change | 420 | -0.022 | 0.037 | 0.555 | 0.038 | 0.037 |
| Year FE | Townships | Negative EAV change | 420 | 0.218** | 0.089 | 0.021 | 0.365 | 0.037 |
| Year FE | Schools | Positive EAV change | 1995 | 0.102* | 0.054 | 0.059 | 0.191 | 0.334 |
| Year FE | Schools | Negative EAV change | 1995 | 0.169*** | 0.041 | 0.000 | 0.236 | 0.334 |
| Year + unit FE | Home-rule municipalities | Positive EAV change | 1001 | 0.070 | 0.060 | 0.249 | 0.168 | 0.937 |
| Year + unit FE | Home-rule municipalities | Negative EAV change | 1001 | 0.077 | 0.064 | 0.229 | 0.182 | 0.937 |
| Year + unit FE | Non-home-rule municipalities | Positive EAV change | 571 | 0.016 | 0.054 | 0.765 | 0.105 | 0.132 |
| Year + unit FE | Non-home-rule municipalities | Negative EAV change | 571 | -0.264 | 0.164 | 0.115 | 0.005 | 0.132 |
| Year + unit FE | Other | Positive EAV change | 2143 | 0.110 | 0.069 | 0.113 | 0.223 | 0.667 |
| Year + unit FE | Other | Negative EAV change | 2143 | 0.001 | 0.199 | 0.998 | 0.328 | 0.667 |
| Year + unit FE | Townships | Positive EAV change | 420 | -0.025 | 0.037 | 0.513 | 0.037 | 0.032 |
| Year + unit FE | Townships | Negative EAV change | 420 | 0.233** | 0.093 | 0.018 | 0.386 | 0.032 |
| Year + unit FE | Schools | Positive EAV change | 1995 | 0.096* | 0.049 | 0.053 | 0.177 | 0.632 |
| Year + unit FE | Schools | Negative EAV change | 1995 | 0.131*** | 0.044 | 0.004 | 0.204 | 0.632 |
| IG revenue + year + unit FE | Home-rule municipalities | Positive EAV change | 479 | 0.293* | 0.172 | 0.095 | 0.576 | 0.320 |
| IG revenue + year + unit FE | Home-rule municipalities | Negative EAV change | 479 | 0.094 | 0.063 | 0.143 | 0.198 | 0.320 |
| IG revenue + year + unit FE | Non-home-rule municipalities | Positive EAV change | 98 | 0.195 | 0.192 | 0.322 | 0.510 | 0.581 |
| IG revenue + year + unit FE | Non-home-rule municipalities | Negative EAV change | 98 | 0.031 | 0.189 | 0.871 | 0.342 | 0.581 |
| IG revenue + year + unit FE | Schools | Positive EAV change | 1722 | 0.175* | 0.095 | 0.067 | 0.331 | 0.594 |
| IG revenue + year + unit FE | Schools | Negative EAV change | 1722 | 0.114** | 0.046 | 0.014 | 0.189 | 0.594 |
| Same sample as IG row, no IG control | Home-rule municipalities | Positive EAV change | 479 | 0.293* | 0.171 | 0.093 | 0.574 | 0.319 |
| Same sample as IG row, no IG control | Home-rule municipalities | Negative EAV change | 479 | 0.093 | 0.063 | 0.147 | 0.198 | 0.319 |
| Same sample as IG row, no IG control | Non-home-rule municipalities | Positive EAV change | 98 | 0.182 | 0.188 | 0.345 | 0.490 | 0.587 |
| Same sample as IG row, no IG control | Non-home-rule municipalities | Negative EAV change | 98 | 0.023 | 0.176 | 0.899 | 0.312 | 0.587 |
| Same sample as IG row, no IG control | Schools | Positive EAV change | 1722 | 0.175* | 0.095 | 0.067 | 0.330 | 0.585 |
| Same sample as IG row, no IG control | Schools | Negative EAV change | 1722 | 0.112** | 0.045 | 0.015 | 0.187 | 0.585 |
| Enrollment + year + unit FE | Schools | Positive EAV change | 1722 | 0.174* | 0.095 | 0.070 | 0.330 | 0.580 |
| Enrollment + year + unit FE | Schools | Negative EAV change | 1722 | 0.111** | 0.045 | 0.015 | 0.184 | 0.580 |
include_table("v22_table_A6_IV_by_type_asym_p_equal.html")| row | agency | p_equal |
|---|---|---|
| No controls | Home-rule municipalities | 0.904 |
| No controls | Non-home-rule municipalities | 0.236 |
| No controls | Other | 0.050 |
| No controls | Townships | 0.160 |
| No controls | Schools | 0.316 |
| Year FE | Home-rule municipalities | 0.707 |
| Year FE | Non-home-rule municipalities | 0.786 |
| Year FE | Other | 0.141 |
| Year FE | Townships | 0.230 |
| Year FE | Schools | 0.936 |
| Year + unit FE | Home-rule municipalities | 0.687 |
| Year + unit FE | Non-home-rule municipalities | 0.834 |
| Year + unit FE | Other | 0.140 |
| Year + unit FE | Townships | 0.233 |
| Year + unit FE | Schools | 0.924 |
| IG revenue + year + unit FE | Home-rule municipalities | 0.096 |
| IG revenue + year + unit FE | Non-home-rule municipalities | 0.042 |
| IG revenue + year + unit FE | Schools | 0.745 |
| Same sample as IG row, no IG control | Home-rule municipalities | 0.098 |
| Same sample as IG row, no IG control | Non-home-rule municipalities | 0.051 |
| Same sample as IG row, no IG control | Schools | 0.769 |
| Enrollment + year + unit FE | Schools | 0.717 |
include_table("v22_table_A7_IV_by_type_asym_point_estimates_wide.html")| row | Home-rule municipalities | Non-home-rule municipalities | Schools | Townships | Other |
|---|---|---|---|---|---|
| No controls | -0.047 | -0.003 | 0.072*** | -0.031 | -0.029 |
| Year FE | -0.013 | -0.085** | 0.010 | -0.021 | -0.113 |
| Year + unit FE | -0.012 | -0.086** | 0.009 | -0.021 | -0.113 |
| IG revenue + year + unit FE | -0.064 | 0.299** | -0.012 | NA | NA |
| Same sample as IG row, no IG control | -0.065 | 0.270** | -0.012 | NA | NA |
| Enrollment + year + unit FE | NA | NA | -0.016 | NA | NA |
include_table("v22_table_A7_IV_by_type_asym_point_estimates.html")| row | agency | N | estimate | std_error | p_value |
|---|---|---|---|---|---|
| No controls | Home-rule municipalities | 1001 | -0.047 | 0.030 | 0.123 |
| No controls | Non-home-rule municipalities | 571 | -0.003 | 0.036 | 0.944 |
| No controls | Other | 2145 | -0.029 | 0.072 | 0.687 |
| No controls | Townships | 420 | -0.031 | 0.044 | 0.484 |
| No controls | Schools | 1995 | 0.072*** | 0.020 | 0.000 |
| Year FE | Home-rule municipalities | 1001 | -0.013 | 0.032 | 0.688 |
| Year FE | Non-home-rule municipalities | 571 | -0.085** | 0.035 | 0.021 |
| Year FE | Other | 2145 | -0.113 | 0.124 | 0.364 |
| Year FE | Townships | 420 | -0.021 | 0.056 | 0.709 |
| Year FE | Schools | 1995 | 0.010 | 0.019 | 0.615 |
| Year + unit FE | Home-rule municipalities | 1001 | -0.012 | 0.032 | 0.710 |
| Year + unit FE | Non-home-rule municipalities | 571 | -0.086** | 0.036 | 0.020 |
| Year + unit FE | Other | 2143 | -0.113 | 0.124 | 0.366 |
| Year + unit FE | Townships | 420 | -0.021 | 0.056 | 0.710 |
| Year + unit FE | Schools | 1995 | 0.009 | 0.019 | 0.640 |
| IG revenue + year + unit FE | Home-rule municipalities | 479 | -0.064 | 0.074 | 0.387 |
| IG revenue + year + unit FE | Non-home-rule municipalities | 98 | 0.299** | 0.116 | 0.019 |
| IG revenue + year + unit FE | Schools | 1722 | -0.012 | 0.033 | 0.723 |
| Same sample as IG row, no IG control | Home-rule municipalities | 479 | -0.065 | 0.075 | 0.387 |
| Same sample as IG row, no IG control | Non-home-rule municipalities | 98 | 0.270** | 0.105 | 0.018 |
| Same sample as IG row, no IG control | Schools | 1722 | -0.012 | 0.033 | 0.713 |
| Enrollment + year + unit FE | Schools | 1722 | -0.016 | 0.032 | 0.614 |
include_table("v22_table_A7_B_IV_by_type_asym_point_estimates_pos_neg_wide.html")| row | Home-rule municipalities | Non-home-rule municipalities | Schools | Townships | Other |
|---|---|---|---|---|---|
| No controls - Positive EAV change | -0.047 | -0.003 | 0.072*** | -0.031 | -0.029 |
| No controls - Negative EAV change | -0.060 | 0.156 | 0.128*** | 0.168 | 0.159** |
| Year FE - Positive EAV change | -0.013 | -0.085** | 0.010 | -0.021 | -0.113 |
| Year FE - Negative EAV change | 0.034 | -0.143 | 0.005 | 0.106 | 0.148 |
| Year + unit FE - Positive EAV change | -0.012 | -0.086** | 0.009 | -0.021 | -0.113 |
| Year + unit FE - Negative EAV change | 0.038 | -0.132 | 0.004 | 0.107 | 0.149 |
| IG revenue + year + unit FE - Positive EAV change | -0.064 | 0.299** | -0.012 | NA | NA |
| IG revenue + year + unit FE - Negative EAV change | 0.144* | -0.039 | 0.009 | NA | NA |
| Same sample as IG row, no IG control - Positive EAV change | -0.065 | 0.270** | -0.012 | NA | NA |
| Same sample as IG row, no IG control - Negative EAV change | 0.142* | -0.047 | 0.006 | NA | NA |
| Enrollment + year + unit FE - Positive EAV change | NA | NA | -0.016 | NA | NA |
| Enrollment + year + unit FE - Negative EAV change | NA | NA | 0.006 | NA | NA |
include_table("v22_table_A7_B_IV_by_type_asym_point_estimates_pos_neg.html")| row | agency | component | N | estimate | std_error | p_value | upper_bound | F_neg | F_pos | SW_F_neg | SW_F_pos | p_exog | p_equal |
|---|---|---|---|---|---|---|---|---|---|---|---|---|---|
| No controls | Home-rule municipalities | Positive EAV change | 1001 | -0.047 | 0.030 | 0.123 | 0.002 | 1581.1 | 558.4 | 566.5 | 667.8 | 0.010 | 0.904 |
| No controls | Home-rule municipalities | Negative EAV change | 1001 | -0.060 | 0.084 | 0.480 | 0.079 | 1581.1 | 558.4 | 566.5 | 667.8 | 0.010 | 0.904 |
| No controls | Non-home-rule municipalities | Positive EAV change | 571 | -0.003 | 0.036 | 0.944 | 0.056 | 823.7 | 1008.6 | 625.4 | 1150.3 | 0.760 | 0.236 |
| No controls | Non-home-rule municipalities | Negative EAV change | 571 | 0.156 | 0.103 | 0.137 | 0.325 | 823.7 | 1008.6 | 625.4 | 1150.3 | 0.760 | 0.236 |
| No controls | Other | Positive EAV change | 2145 | -0.029 | 0.072 | 0.687 | 0.089 | 2998.9 | 1073.9 | 1130.5 | 1282.1 | 0.377 | 0.050 |
| No controls | Other | Negative EAV change | 2145 | 0.159** | 0.071 | 0.027 | 0.276 | 2998.9 | 1073.9 | 1130.5 | 1282.1 | 0.377 | 0.050 |
| No controls | Townships | Positive EAV change | 420 | -0.031 | 0.044 | 0.484 | 0.041 | 979.0 | 1099.4 | 582.6 | 794.5 | 0.172 | 0.160 |
| No controls | Townships | Negative EAV change | 420 | 0.168 | 0.107 | 0.126 | 0.344 | 979.0 | 1099.4 | 582.6 | 794.5 | 0.172 | 0.160 |
| No controls | Schools | Positive EAV change | 1995 | 0.072*** | 0.020 | 0.000 | 0.105 | 2869.6 | 1631.7 | 1425.6 | 1536.0 | 0.339 | 0.316 |
| No controls | Schools | Negative EAV change | 1995 | 0.128*** | 0.040 | 0.002 | 0.194 | 2869.6 | 1631.7 | 1425.6 | 1536.0 | 0.339 | 0.316 |
| Year FE | Home-rule municipalities | Positive EAV change | 1001 | -0.013 | 0.032 | 0.688 | 0.040 | 202.1 | 404.2 | 325.9 | 809.3 | 0.398 | 0.707 |
| Year FE | Home-rule municipalities | Negative EAV change | 1001 | 0.034 | 0.107 | 0.754 | 0.209 | 202.1 | 404.2 | 325.9 | 809.3 | 0.398 | 0.707 |
| Year FE | Non-home-rule municipalities | Positive EAV change | 571 | -0.085** | 0.035 | 0.021 | -0.027 | 125.6 | 1162.2 | 211.8 | 1768.2 | 0.154 | 0.786 |
| Year FE | Non-home-rule municipalities | Negative EAV change | 571 | -0.143 | 0.195 | 0.470 | 0.178 | 125.6 | 1162.2 | 211.8 | 1768.2 | 0.154 | 0.786 |
| Year FE | Other | Positive EAV change | 2145 | -0.113 | 0.124 | 0.364 | 0.091 | 373.0 | 918.5 | 657.2 | 1676.2 | 0.289 | 0.141 |
| Year FE | Other | Negative EAV change | 2145 | 0.148 | 0.112 | 0.189 | 0.332 | 373.0 | 918.5 | 657.2 | 1676.2 | 0.289 | 0.141 |
| Year FE | Townships | Positive EAV change | 420 | -0.021 | 0.056 | 0.709 | 0.072 | 113.4 | 649.4 | 231.4 | 1301.0 | 0.237 | 0.230 |
| Year FE | Townships | Negative EAV change | 420 | 0.106 | 0.068 | 0.130 | 0.218 | 113.4 | 649.4 | 231.4 | 1301.0 | 0.237 | 0.230 |
| Year FE | Schools | Positive EAV change | 1995 | 0.010 | 0.019 | 0.615 | 0.041 | 346.1 | 725.5 | 599.2 | 1447.1 | 0.001 | 0.936 |
| Year FE | Schools | Negative EAV change | 1995 | 0.005 | 0.050 | 0.920 | 0.088 | 346.1 | 725.5 | 599.2 | 1447.1 | 0.001 | 0.936 |
| Year + unit FE | Home-rule municipalities | Positive EAV change | 1001 | -0.012 | 0.032 | 0.710 | 0.041 | 199.9 | 400.6 | 322.9 | 806.3 | 0.410 | 0.687 |
| Year + unit FE | Home-rule municipalities | Negative EAV change | 1001 | 0.038 | 0.108 | 0.724 | 0.215 | 199.9 | 400.6 | 322.9 | 806.3 | 0.410 | 0.687 |
| Year + unit FE | Non-home-rule municipalities | Positive EAV change | 571 | -0.086** | 0.036 | 0.020 | -0.028 | 119.3 | 1176.6 | 188.7 | 1765.3 | 0.238 | 0.834 |
| Year + unit FE | Non-home-rule municipalities | Negative EAV change | 571 | -0.132 | 0.200 | 0.513 | 0.197 | 119.3 | 1176.6 | 188.7 | 1765.3 | 0.238 | 0.834 |
| Year + unit FE | Other | Positive EAV change | 2143 | -0.113 | 0.124 | 0.366 | 0.092 | 370.6 | 910.9 | 657.5 | 1668.5 | 0.356 | 0.140 |
| Year + unit FE | Other | Negative EAV change | 2143 | 0.149 | 0.112 | 0.185 | 0.334 | 370.6 | 910.9 | 657.5 | 1668.5 | 0.356 | 0.140 |
| Year + unit FE | Townships | Positive EAV change | 420 | -0.021 | 0.056 | 0.710 | 0.071 | 112.3 | 650.6 | 231.2 | 1311.5 | 0.179 | 0.233 |
| Year + unit FE | Townships | Negative EAV change | 420 | 0.107 | 0.069 | 0.134 | 0.220 | 112.3 | 650.6 | 231.2 | 1311.5 | 0.179 | 0.233 |
| Year + unit FE | Schools | Positive EAV change | 1995 | 0.009 | 0.019 | 0.640 | 0.040 | 342.7 | 722.3 | 593.0 | 1444.6 | 0.005 | 0.924 |
| Year + unit FE | Schools | Negative EAV change | 1995 | 0.004 | 0.050 | 0.942 | 0.086 | 342.7 | 722.3 | 593.0 | 1444.6 | 0.005 | 0.924 |
| IG revenue + year + unit FE | Home-rule municipalities | Positive EAV change | 479 | -0.064 | 0.074 | 0.387 | 0.057 | 92.4 | 116.8 | 223.0 | 229.3 | 0.063 | 0.096 |
| IG revenue + year + unit FE | Home-rule municipalities | Negative EAV change | 479 | 0.144* | 0.079 | 0.076 | 0.274 | 92.4 | 116.8 | 223.0 | 229.3 | 0.063 | 0.096 |
| IG revenue + year + unit FE | Non-home-rule municipalities | Positive EAV change | 98 | 0.299** | 0.116 | 0.019 | 0.490 | 121.3 | 15.2 | 292.0 | 36.3 | 0.876 | 0.042 |
| IG revenue + year + unit FE | Non-home-rule municipalities | Negative EAV change | 98 | -0.039 | 0.113 | 0.735 | 0.147 | 121.3 | 15.2 | 292.0 | 36.3 | 0.876 | 0.042 |
| IG revenue + year + unit FE | Schools | Positive EAV change | 1722 | -0.012 | 0.033 | 0.723 | 0.043 | 287.7 | 367.8 | 604.1 | 769.4 | 0.004 | 0.745 |
| IG revenue + year + unit FE | Schools | Negative EAV change | 1722 | 0.009 | 0.050 | 0.866 | 0.092 | 287.7 | 367.8 | 604.1 | 769.4 | 0.004 | 0.745 |
| Same sample as IG row, no IG control | Home-rule municipalities | Positive EAV change | 479 | -0.065 | 0.075 | 0.387 | 0.058 | 93.2 | 116.7 | 223.5 | 228.6 | 0.064 | 0.098 |
| Same sample as IG row, no IG control | Home-rule municipalities | Negative EAV change | 479 | 0.142* | 0.080 | 0.080 | 0.273 | 93.2 | 116.7 | 223.5 | 228.6 | 0.064 | 0.098 |
| Same sample as IG row, no IG control | Non-home-rule municipalities | Positive EAV change | 98 | 0.270** | 0.105 | 0.018 | 0.442 | 150.3 | 16.4 | 311.6 | 38.2 | 0.884 | 0.051 |
| Same sample as IG row, no IG control | Non-home-rule municipalities | Negative EAV change | 98 | -0.047 | 0.108 | 0.668 | 0.131 | 150.3 | 16.4 | 311.6 | 38.2 | 0.884 | 0.051 |
| Same sample as IG row, no IG control | Schools | Positive EAV change | 1722 | -0.012 | 0.033 | 0.713 | 0.042 | 288.8 | 366.9 | 606.0 | 772.5 | 0.004 | 0.769 |
| Same sample as IG row, no IG control | Schools | Negative EAV change | 1722 | 0.006 | 0.051 | 0.905 | 0.090 | 288.8 | 366.9 | 606.0 | 772.5 | 0.004 | 0.769 |
| Enrollment + year + unit FE | Schools | Positive EAV change | 1722 | -0.016 | 0.032 | 0.614 | 0.037 | 287.5 | 368.6 | 609.4 | 774.4 | 0.003 | 0.717 |
| Enrollment + year + unit FE | Schools | Negative EAV change | 1722 | 0.006 | 0.051 | 0.903 | 0.090 | 287.5 | 368.6 | 609.4 | 774.4 | 0.003 | 0.717 |
include_table("v22_table_A8_OLS_by_type_lagged_p_values.html")| row | agency | cumulative_effect_p | p_lags | joint_lag_F | joint_lag_p |
|---|---|---|---|---|---|
| No controls | Home-rule municipalities | 0.067 | 0.016 | 3.1 | 0.044 |
| No controls | Non-home-rule municipalities | 0.146 | 0.679 | 4.8 | 0.008 |
| No controls | Other | 0.000 | 0.046 | 2.1 | 0.126 |
| No controls | Townships | 0.040 | 0.011 | 5.4 | 0.005 |
| No controls | Schools | 0.000 | 0.196 | 4.9 | 0.008 |
| Year FE | Home-rule municipalities | 0.554 | 0.809 | 0.1 | 0.948 |
| Year FE | Non-home-rule municipalities | 0.080 | 0.026 | 3.7 | 0.026 |
| Year FE | Other | 0.111 | 0.209 | 0.9 | 0.408 |
| Year FE | Townships | 0.712 | 0.728 | 0.7 | 0.518 |
| Year FE | Schools | 0.000 | 0.000 | 12.0 | 0.000 |
| Year + unit FE | Home-rule municipalities | 0.385 | 0.552 | 0.3 | 0.730 |
| Year + unit FE | Non-home-rule municipalities | 0.259 | 0.095 | 2.8 | 0.061 |
| Year + unit FE | Other | 0.262 | 0.392 | 0.8 | 0.447 |
| Year + unit FE | Townships | 0.585 | 0.574 | 0.7 | 0.489 |
| Year + unit FE | Schools | 0.001 | 0.001 | 5.4 | 0.005 |
| IG revenue + year + unit FE | Home-rule municipalities | 0.214 | 0.477 | 0.3 | 0.765 |
| IG revenue + year + unit FE | Non-home-rule municipalities | 0.643 | 0.784 | 0.0 | 0.962 |
| IG revenue + year + unit FE | Schools | 0.004 | 0.007 | 3.8 | 0.023 |
| Same sample as IG row, no IG control | Home-rule municipalities | 0.214 | 0.478 | 0.3 | 0.759 |
| Same sample as IG row, no IG control | Non-home-rule municipalities | 0.688 | 0.736 | 0.1 | 0.939 |
| Same sample as IG row, no IG control | Schools | 0.005 | 0.008 | 3.7 | 0.025 |
| Enrollment + year + unit FE | Schools | 0.004 | 0.006 | 4.0 | 0.019 |
include_table("v22_table_A9_OLS_by_type_lagged_point_estimates_wide.html")| row | Home-rule municipalities | Non-home-rule municipalities | Schools | Townships | Other |
|---|---|---|---|---|---|
| No controls | 0.073* | 0.065 | 0.114*** | 0.054** | 0.171*** |
| Year FE | 0.110 | 0.233* | 0.343*** | 0.036 | 0.391 |
| Year + unit FE | 0.146 | 0.161 | 0.257*** | 0.070 | 0.300 |
| IG revenue + year + unit FE | 0.361 | 0.098 | 0.280*** | NA | NA |
| Same sample as IG row, no IG control | 0.360 | 0.075 | 0.278*** | NA | NA |
| Enrollment + year + unit FE | NA | NA | 0.278*** | NA | NA |
include_table("v22_table_A9_OLS_by_type_lagged_point_estimates.html")| row | agency | lagged_magnitude | std_error | lagged_p |
|---|---|---|---|---|
| No controls | Home-rule municipalities | 0.073* | 0.039 | 0.067 |
| No controls | Non-home-rule municipalities | 0.065 | 0.043 | 0.146 |
| No controls | Other | 0.171*** | 0.043 | 0.000 |
| No controls | Townships | 0.054** | 0.025 | 0.040 |
| No controls | Schools | 0.114*** | 0.021 | 0.000 |
| Year FE | Home-rule municipalities | 0.110 | 0.184 | 0.554 |
| Year FE | Non-home-rule municipalities | 0.233* | 0.130 | 0.080 |
| Year FE | Other | 0.391 | 0.244 | 0.111 |
| Year FE | Townships | 0.036 | 0.098 | 0.712 |
| Year FE | Schools | 0.343*** | 0.082 | 0.000 |
| Year + unit FE | Home-rule municipalities | 0.146 | 0.168 | 0.385 |
| Year + unit FE | Non-home-rule municipalities | 0.161 | 0.140 | 0.259 |
| Year + unit FE | Other | 0.300 | 0.267 | 0.262 |
| Year + unit FE | Townships | 0.070 | 0.127 | 0.585 |
| Year + unit FE | Schools | 0.257*** | 0.078 | 0.001 |
| IG revenue + year + unit FE | Home-rule municipalities | 0.361 | 0.287 | 0.214 |
| IG revenue + year + unit FE | Non-home-rule municipalities | 0.098 | 0.208 | 0.643 |
| IG revenue + year + unit FE | Schools | 0.280*** | 0.096 | 0.004 |
| Same sample as IG row, no IG control | Home-rule municipalities | 0.360 | 0.287 | 0.214 |
| Same sample as IG row, no IG control | Non-home-rule municipalities | 0.075 | 0.185 | 0.688 |
| Same sample as IG row, no IG control | Schools | 0.278*** | 0.096 | 0.005 |
| Enrollment + year + unit FE | Schools | 0.278*** | 0.095 | 0.004 |