Code
library(modelsummary)
library(tidyverse)
library(janitor)
library(dplyr)
library(fixest)
library(sandwich)

df <- read_csv("NTA_data_2024_11_06.csv")library(modelsummary)
library(tidyverse)
library(janitor)
library(dplyr)
library(fixest)
library(sandwich)
df <- read_csv("NTA_data_2024_11_06.csv")datasummary_crosstab(type ~home_rule_ind, statistic = 1~1+N,
data = df %>% filter(year==2022), output = "flextable")type |
| 0 | 1 | All |
|---|---|---|---|---|
Muni | N | 37 | 70 | 107 |
Other | N | 150 | 0 | 150 |
School | N | 137 | 0 | 137 |
Township | N | 28 | 0 | 28 |
All | N | 352 | 70 | 422 |
 df %>%
  filter(year == 2006 | year == 2023 ) %>%
  filter(!is.na(total_final_levy)) %>%
  group_by(agency_group) %>%
  summarize(n = n()) %>% arrange(desc(n))
levy_table <- df %>%
  filter(year == 2006 | year == 2023 ) %>%
  filter(!is.na(total_final_levy)) %>%
  select(year, agency_group, total_final_levy) %>%
  pivot_wider( id_cols = "agency_group", names_from = "year",
               values_from = "total_final_levy") %>%
  mutate(pct_growth = (round((`2023`-`2006`)/`2006` * 100, digits = 1) ) ) %>%
  arrange(desc(pct_growth)) %>%
    filter(!is.na(pct_growth))

levy_table %>%
DT::datatable(rownames = FALSE)total_final_levy for grouped munis and townships.
df %>%
  filter((year == 2006 | year == 2023) ) %>%
  select(year, agency_group, total_final_levy) %>%
  pivot_wider( id_cols = c("agency_group"), names_from = "year",
               values_from = "total_final_levy") %>%
  mutate(pct_growth = (round((`2023`-`2006`)/`2006` * 100, digits = 1) )) %>%
    filter(!is.na(pct_growth)) %>%
  ggplot() +
  geom_histogram(aes(x=pct_growth)) +
  theme_classic() +
  labs(x = "Growth %", y = "Agency Count",
       title = "Distribution of Growth Rates",
       subtitle = "Summed Levy per Grouped Agency, 2006 to 2022")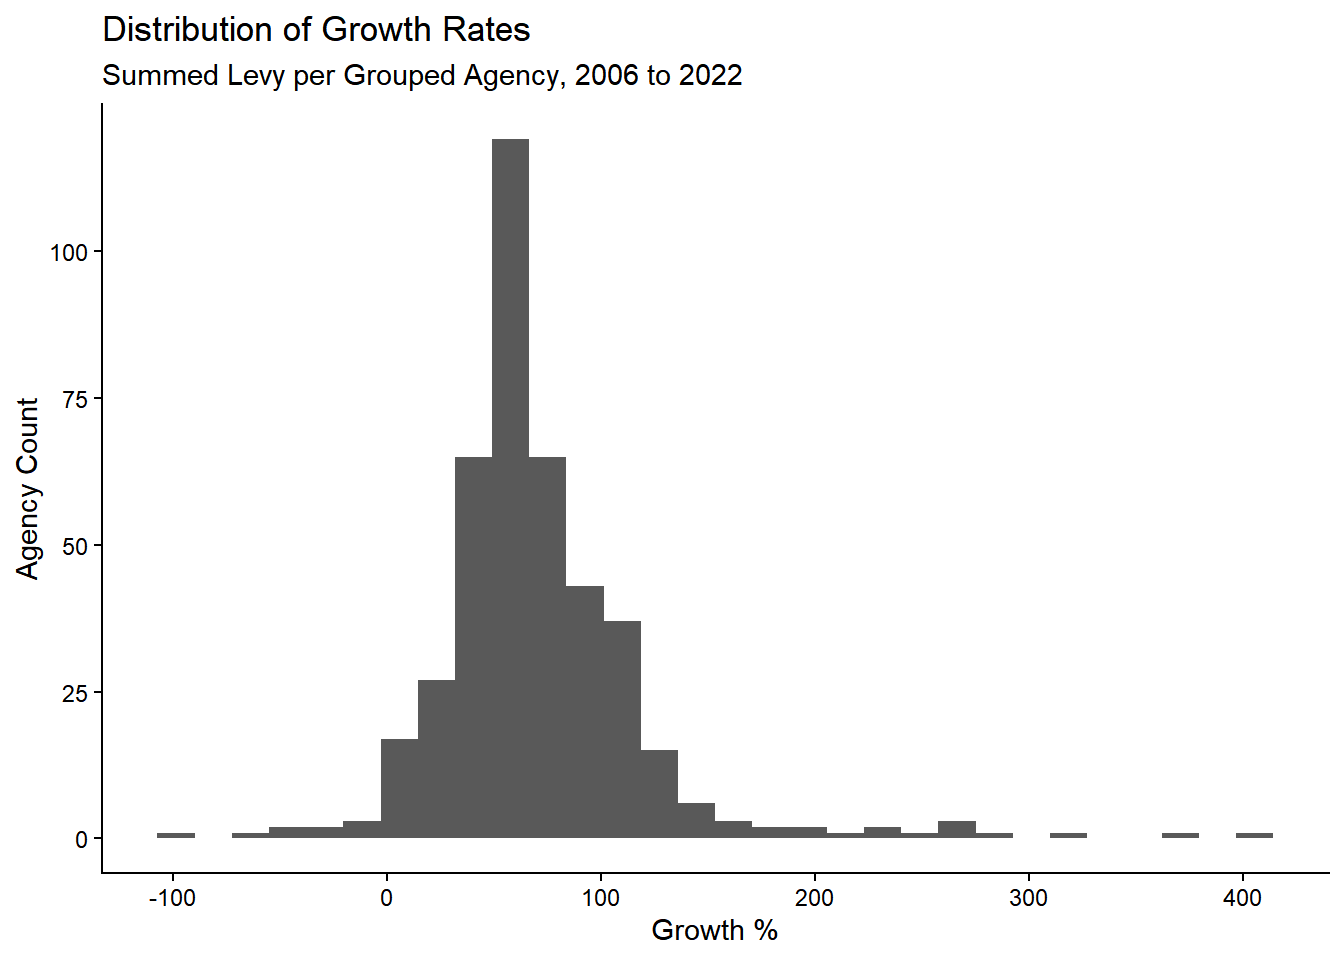
df %>%
  filter((year == 2006 | year == 2023) ) %>%
  select(year, agency_group, total_final_levy) %>%
  pivot_wider( id_cols = c("agency_group"), names_from = "year",
               values_from = "total_final_levy") %>%
  mutate(pct_growth = (round((`2023`-`2006`)/`2006` * 100, digits = 1) )) %>%
    filter(!is.na(pct_growth)) %>%

  ungroup() %>%
  summarize(
    `2006 Median Levy` = median(`2006`, na.rm=TRUE),
    `2006 Mean Levy` = mean(`2006`, na.rm=TRUE),
    `2006 Levy StdDv` = (sd(`2006`, na.rm=TRUE)),
    `2023 Median Levy` = median(`2023`, na.rm=TRUE),
    `2023 Mean Levy` = mean(`2023`, na.rm=TRUE),
    `2023 Levy StdDv` = round(sd(`2023`, na.rm=TRUE), digits = 2),
    `Median Growth of Levy` = round(median(pct_growth, na.rm=TRUE), digits = 2),
    `Mean Growth of Levy` = round(mean(pct_growth, na.rm=TRUE), digits = 2),
    `Growth StdDv` = round(sd(pct_growth, na.rm=TRUE)),
    `# of Agencies` = n()
  ) |>
  mutate(across(where(is.numeric), round, digits = 1)) %>%

  pivot_longer(cols = c(`2006 Median Levy`:`# of Agencies`),
               names_to = "statistic", values_to = "value") |>
  flextable::flextable(cwidth = 1.5)
 # DT::datatable(rownames = FALSE)
statistic | value |
|---|---|
2006 Median Levy | 4,479,175.0 |
2006 Mean Levy | 11,328,762.3 |
2006 Levy StdDv | 21,336,660.6 |
2023 Median Levy | 7,403,888.0 |
2023 Mean Levy | 18,730,965.2 |
2023 Levy StdDv | 34,022,326.1 |
Median Growth of Levy | 62.7 |
Mean Growth of Levy | 71.2 |
Growth StdDv | 51.0 |
# of Agencies | 421.0 |
levy_table <- df %>%
  group_by(year, type) %>%
  summarize(total_final_levy = median(total_final_levy, na.rm=TRUE) ) %>%
  filter(year == 2006 | year == 2023 ) %>%
  filter(!is.na(total_final_levy)) %>%
  select(year, type, total_final_levy) %>%
  pivot_wider( id_cols = "type", names_from = "year",
               values_from = "total_final_levy") %>%
  mutate(pct_growth = (round((`2023`-`2006`)/`2006` * 100, digits = 1) ) ) %>%
  arrange(desc(pct_growth)) %>%
    filter(!is.na(pct_growth))

levy_table %>%
DT::datatable(rownames = FALSE)total_final_levy for grouped munis and townships.
df %>%
  group_by(year, type) %>%
  summarize(total_final_levy = sum(total_final_levy, na.rm=TRUE),
            median_levy = median(total_final_levy)) %>%
filter((year == 2006 | year == 2023) ) taxbase_table <- df %>%
filter(year == 2006 | year == 2023) %>%
select(year, agency_group, cty_cook_eav) %>%
pivot_wider(id_cols = "agency_group", names_from = "year",
values_from = "cty_cook_eav") %>%
mutate(pct_growth = (round((`2023`-`2006`)/`2006` * 100, digits = 1) ) ) %>%
mutate(across(where(is.numeric), round, digits = 2)) %>%
filter(!is.na(pct_growth))
taxbase_table %>%
arrange(desc(pct_growth)) %>%
DT::datatable(rownames = FALSE)df %>%
filter(year == 2006 | year == 2023) %>%
# filter(town == "Muni" ) %>%
select(year, agency_group, cty_cook_eav) %>%
pivot_wider(id_cols = "agency_group", names_from = "year",
values_from = "cty_cook_eav") %>%
mutate(pct_growth = (round((`2023`-`2006`)/`2006` * 100, digits = 1) ) ) %>%
filter(!is.na(pct_growth)) %>%
ungroup() %>%
summarize(
`2006 Median Tax Base` = median(`2006`, na.rm=TRUE),
`2006 Mean` = mean(`2006`, na.rm=TRUE),
`2006 Tax Base StdDv` = (sd(`2006`, na.rm=TRUE)),
`2023 Median Tax Base` = median(`2023`, na.rm=TRUE),
`2023 Mean` = mean(`2023`, na.rm=TRUE),
`2023 Tax Base StdDv` = round(sd(`2023`, na.rm=TRUE)),
`Median Growth of Tax Base` = round(median(pct_growth, na.rm=TRUE), digits = 2),
`Mean Growth of Tax Base` = round(mean(pct_growth, na.rm=TRUE), digits = 2),
`Growth StdDv` = round(sd(pct_growth, na.rm=TRUE), digits = 2),
`# of Agencies` = n()
) |>
mutate(across(where(is.numeric), round)) %>%
pivot_longer(cols = c(`2006 Median Tax Base`:`# of Agencies`),
names_to = "statistic", values_to = "value") |>
flextable::flextable(cwidth = 1.5)statistic | value |
|---|---|
2006 Median Tax Base | 447,227,917 |
2006 Mean | 854,784,502 |
2006 Tax Base StdDv | 1,171,734,822 |
2023 Median Tax Base | 562,587,781 |
2023 Mean | 1,139,858,586 |
2023 Tax Base StdDv | 1,537,932,182 |
Median Growth of Tax Base | 31 |
Mean Growth of Tax Base | 32 |
Growth StdDv | 24 |
# of Agencies | 422 |
 # DT::datatable(rownames = FALSE) %>%
# DT::formatRound('value', mark = ",", digits = 0) taxbase_table %>%
ggplot() +
geom_histogram(aes(x=pct_growth)) + theme_classic() +
labs(x = "Growth %", y = "Agency Count",
title = "Growth in Tax Base (in EAV), 2006 to 2022")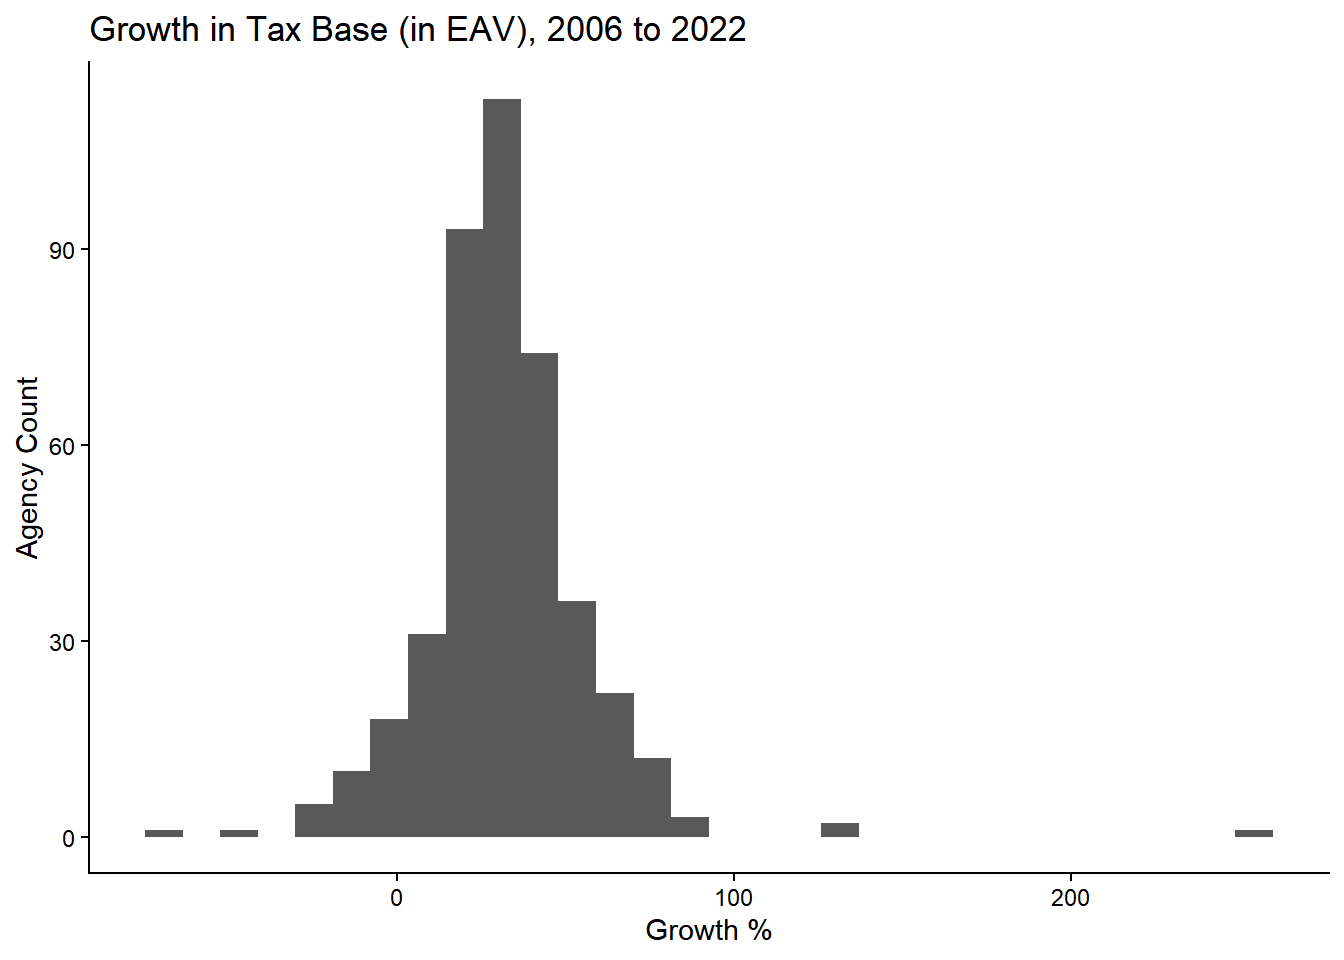
df %>% group_by(year,type) %>%
  summarize(cty_cook_eav = median(cty_cook_eav, na.rm=TRUE) ) %>%
  filter(year == 2006 | year == 2023 ) %>%
  filter(!is.na(cty_cook_eav)) %>%
  select(year, type, cty_cook_eav) %>%
  pivot_wider( id_cols = "type", names_from = "year",
               values_from = "cty_cook_eav") %>%
  mutate(pct_growth = (round((`2023`-`2006`)/`2006` * 100, digits = 1) ) ) %>%
  arrange(desc(pct_growth)) %>%
filter(!is.na(pct_growth))First year is 2006, last year is 2022.
current_year <- 2023
taxbasessums <- df %>% group_by(year) %>%
  summarize(cty_cook_eav = sum(cty_cook_eav, na.rm=TRUE))

# function for calculating the CAGR
calc_cagr <- function(df, n) {
  df <- taxbasessums %>%
     arrange(year) %>%
  #  group_by(agency_group) %>%
    mutate(cagr = ((`cty_cook_eav` / lag(`cty_cook_eav`, n)) ^ (1 / n)) - 1)

  return(df)
}

# 2011 to 2022 is 12 years of data
cagr_12 <- calc_cagr(taxbasessums, 18) %>%
    filter(year == as.numeric(as.character(current_year))) %>%
  summarize(cagr_12 = case_when(year == current_year ~ round(sum(cagr*100, na.rm = TRUE), 2)))

cagr_10 <- calc_cagr(taxbasessums, 10) %>%
    filter(year == as.numeric(as.character(current_year))) %>%
  summarize(cagr_10 = case_when(year == current_year ~ round(sum(cagr*100, na.rm = TRUE), 2)))

cagr_5 <- calc_cagr(taxbasessums, 5) %>%
  filter(year == as.numeric(as.character(current_year))) %>%
  summarize(cagr_5 = case_when(year == current_year ~ round(sum(cagr*100, na.rm = TRUE), 2)))

cagr_3 <- calc_cagr(taxbasessums, 3) %>%
  filter(year == current_year) %>%
  summarize(cagr_3 = case_when(year == current_year ~ round(sum(cagr*100, na.rm = TRUE), 2)))

cagr_2 <- calc_cagr(taxbasessums, 2) %>%
  filter(year == current_year) %>%
  summarize(cagr_2 = case_when(year == current_year ~ round(sum(cagr*100, na.rm = TRUE), 2)))

cagr_1 <- calc_cagr(taxbasessums, 1) %>%
  filter(year == current_year) %>%
  summarize(cagr_1 = case_when(year == current_year ~ round(sum(cagr*100, na.rm = TRUE), 2)))

# update variables so cagr_24 becomes cagr_25
CAGR_taxbase <- data.frame(cagr_1, cagr_2, cagr_3, cagr_5, cagr_10, cagr_12 ) %>%
 # select(-c(agency_group.1, agency_group.2, agency_group.3, agency_group.4, agency_group.5 )) %>%
  rename(#"Unique ID" = agency_group,
         "1 Year CAGR" = cagr_1, "2 Year CAGR" = cagr_2, "3 Year CAGR" = cagr_3, "5 Year CAGR" = cagr_5, "10 Year CAGR" = cagr_10, "18 Year CAGR" = cagr_12)


CAGR_taxbase%>%
  DT::datatable(rownames = FALSE)