| High FF × Post | High FF × Post, identified term only | |
|---|---|---|
| high_ff_scoreTRUE | -0.517 | |
| (15358.633) | ||
| eventTRUE | 0.058*** | 0.058*** |
| (0.006) | (0.006) | |
| high_ff_scoreTRUE × eventTRUE | -0.106*** | |
| (0.011) | ||
| i(factor_var = event, var = high_ff_score, ref = FALSE) | -0.106*** | |
| (0.011) | ||
| Num.Obs. | 666566 | 666566 |
| R2 | 0.859 | 0.859 |
| R2 Within | 0.002 | 0.002 |
| Std.Errors | by: pin10 | by: pin10 |
| FE: pin | X | X |
| FE: sale_year | X | X |
FF Variable Checks
Separated Timing and Underlying Risk
The following models separate the timing of Flood Factor information release from the underlying level of flood risk. Property fixed effects absorb time-invariant parcel characteristics, while year fixed effects control for broader market conditions.
event == TRUE for all sales that occurred after First Street released its flood risk data.
high_ff_score == TRUE for properties that had a Flood Factor score of 5 or higher.
Binary High Flood Factor Models
The binary specifications estimate whether properties with high Flood Factor scores experienced differential price changes after Flood Factor information became publicly available. The specification using i(event, high_ff_score, ref = FALSE) keeps the identified post-release contrast while avoiding the time-invariant main effect that is absorbed by property fixed effects.
After Flood Factor information became available, high-risk properties sold for lower prices relative to lower-risk properties, net of property fixed effects and overall market time effects.
Ordinal Flood Factor Models
The ordinal specifications estimate separate post-release effects for each Flood Factor score category. These models are useful for identifying whether the price response is concentrated among higher Flood Factor scores rather than changing linearly across the full scale.
| Ordinal | Ordinal × Triad | Change Type × Ordinal × Event × Triad | Change Type × Ordinal × Event | |
|---|---|---|---|---|
| eventTRUE | 0.061*** | 0.015* | 0.015* | 0.060*** |
| (0.006) | (0.008) | (0.008) | (0.006) | |
| ff_score_ord2 × eventTRUE | 0.023 | 0.013 | 0.012 | 0.022 |
| (0.040) | (0.061) | (0.061) | (0.041) | |
| ff_score_ord3 × eventTRUE | -0.028 | -0.030 | -0.031 | -0.030 |
| (0.020) | (0.027) | (0.027) | (0.020) | |
| ff_score_ord4 × eventTRUE | -0.015 | -0.036 | -0.033 | -0.020 |
| (0.019) | (0.027) | (0.027) | (0.020) | |
| ff_score_ord5 × eventTRUE | -0.073** | -0.095** | -0.095** | -0.080** |
| (0.027) | (0.033) | (0.033) | (0.028) | |
| ff_score_ord6 × eventTRUE | -0.118*** | -0.144*** | -0.123*** | -0.108*** |
| (0.015) | (0.017) | (0.018) | (0.015) | |
| ff_score_ord7 × eventTRUE | -0.068** | -0.101*** | -0.101*** | -0.082*** |
| (0.022) | (0.027) | (0.028) | (0.024) | |
| ff_score_ord8 × eventTRUE | -0.163*** | -0.154*** | -0.154*** | -0.181*** |
| (0.021) | (0.020) | (0.020) | (0.019) | |
| ff_score_ord9 × eventTRUE | -0.126*** | -0.163*** | -0.164*** | -0.144*** |
| (0.018) | (0.016) | (0.016) | (0.018) | |
| ff_score_ord10 × eventTRUE | -0.071+ | -0.217*** | -0.222*** | -0.114* |
| (0.038) | (0.041) | (0.041) | (0.045) | |
| eventTRUE × TriadNorth | -0.020* | -0.021** | ||
| (0.008) | (0.008) | |||
| eventTRUE × TriadSouth | 0.181*** | 0.180*** | ||
| (0.008) | (0.008) | |||
| ff_score_ord2 × eventTRUE × TriadNorth | -0.025 | -0.029 | ||
| (0.067) | (0.066) | |||
| ff_score_ord3 × eventTRUE × TriadNorth | -0.027 | -0.038 | ||
| (0.038) | (0.039) | |||
| ff_score_ord4 × eventTRUE × TriadNorth | 0.061+ | 0.038 | ||
| (0.033) | (0.032) | |||
| ff_score_ord5 × eventTRUE × TriadNorth | 0.065+ | 0.055 | ||
| (0.038) | (0.040) | |||
| ff_score_ord6 × eventTRUE × TriadNorth | 0.158*** | 0.126*** | ||
| (0.025) | (0.027) | |||
| ff_score_ord7 × eventTRUE × TriadNorth | 0.187*** | 0.201*** | ||
| (0.040) | (0.044) | |||
| ff_score_ord8 × eventTRUE × TriadNorth | 0.123** | 0.126** | ||
| (0.044) | (0.047) | |||
| ff_score_ord9 × eventTRUE × TriadNorth | 0.229*** | 0.217*** | ||
| (0.047) | (0.057) | |||
| ff_score_ord10 × eventTRUE × TriadNorth | 0.236*** | 0.147* | ||
| (0.056) | (0.064) | |||
| ff_score_ord2 × eventTRUE × TriadSouth | 0.064 | 0.070 | ||
| (0.067) | (0.067) | |||
| ff_score_ord3 × eventTRUE × TriadSouth | 0.087** | 0.094** | ||
| (0.032) | (0.032) | |||
| ff_score_ord4 × eventTRUE × TriadSouth | 0.072* | 0.071* | ||
| (0.031) | (0.031) | |||
| ff_score_ord5 × eventTRUE × TriadSouth | 0.141*** | 0.131** | ||
| (0.042) | (0.043) | |||
| ff_score_ord6 × eventTRUE × TriadSouth | 0.150*** | 0.127*** | ||
| (0.022) | (0.024) | |||
| ff_score_ord7 × eventTRUE × TriadSouth | 0.040 | -0.001 | ||
| (0.052) | (0.059) | |||
| ff_score_ord8 × eventTRUE × TriadSouth | 0.093 | -0.032 | ||
| (0.078) | (0.117) | |||
| ff_score_ord9 × eventTRUE × TriadSouth | 0.222*** | 0.245*** | ||
| (0.044) | (0.053) | |||
| ff_score_ord10 × eventTRUE × TriadSouth | 0.123* | 0.147* | ||
| (0.060) | (0.060) | |||
| change_typeAlways SFHA × eventTRUE | -0.373*** | 0.015 | ||
| (0.069) | (0.072) | |||
| change_typeAlways SFHA × ff_score_ord2 × eventTRUE | -0.130 | 0.073 | ||
| (0.102) | (0.109) | |||
| change_typeAlways SFHA × ff_score_ord3 × eventTRUE | -0.132 | 0.074 | ||
| (0.088) | (0.082) | |||
| change_typeAlways SFHA × ff_score_ord4 × eventTRUE | -0.150* | 0.057 | ||
| (0.074) | (0.100) | |||
| change_typeAlways SFHA × ff_score_ord6 × eventTRUE | 0.111 | -0.116 | ||
| (0.074) | (0.087) | |||
| change_typeAlways SFHA × ff_score_ord7 × eventTRUE | 0.368*** | 0.114 | ||
| (0.079) | (0.090) | |||
| change_typeAlways SFHA × ff_score_ord8 × eventTRUE | 0.214 | 0.328*** | ||
| (0.141) | (0.098) | |||
| change_typeAlways SFHA × ff_score_ord9 × eventTRUE | 0.397*** | 0.206* | ||
| (0.089) | (0.091) | |||
| change_typeAlways SFHA × ff_score_ord10 × eventTRUE | 0.616*** | 0.113 | ||
| (0.108) | (0.091) | |||
| change_typeAlways SFHA × eventTRUE × TriadNorth | 0.478*** | |||
| (0.082) | ||||
| change_typeAlways SFHA × eventTRUE × TriadSouth | 0.397*** | |||
| (0.088) | ||||
| change_typeAlways SFHA × ff_score_ord2 × eventTRUE × TriadNorth | 0.189 | |||
| (0.184) | ||||
| change_typeAlways SFHA × ff_score_ord3 × eventTRUE × TriadNorth | 0.183+ | |||
| (0.109) | ||||
| change_typeAlways SFHA × ff_score_ord4 × eventTRUE × TriadNorth | 0.167 | |||
| (0.107) | ||||
| change_typeAlways SFHA × ff_score_ord6 × eventTRUE × TriadNorth | -0.124 | |||
| (0.093) | ||||
| change_typeAlways SFHA × ff_score_ord7 × eventTRUE × TriadNorth | -0.553*** | |||
| (0.110) | ||||
| change_typeAlways SFHA × ff_score_ord8 × eventTRUE × TriadNorth | -0.329+ | |||
| (0.175) | ||||
| change_typeAlways SFHA × ff_score_ord9 × eventTRUE × TriadNorth | -0.437*** | |||
| (0.123) | ||||
| change_typeAlways SFHA × ff_score_ord10 × eventTRUE × TriadNorth | -0.567*** | |||
| (0.129) | ||||
| change_typeAlways SFHA × ff_score_ord4 × eventTRUE × TriadSouth | 0.105 | |||
| (0.117) | ||||
| change_typeAlways SFHA × ff_score_ord6 × eventTRUE × TriadSouth | -0.121 | |||
| (0.098) | ||||
| change_typeAlways SFHA × ff_score_ord7 × eventTRUE × TriadSouth | -0.230* | |||
| (0.117) | ||||
| change_typeAlways SFHA × ff_score_ord9 × eventTRUE × TriadSouth | -0.486*** | |||
| (0.130) | ||||
| change_typeAlways SFHA × ff_score_ord10 × eventTRUE × TriadSouth | -0.710*** | |||
| (0.159) | ||||
| Num.Obs. | 666364 | 666364 | 666364 | 666364 |
| R2 | 0.859 | 0.861 | 0.861 | 0.859 |
| R2 Within | 0.002 | 0.012 | 0.013 | 0.002 |
| Std.Errors | by: pin10 | by: pin10 | by: pin10 | by: pin10 |
| FE: pin | X | X | X | X |
| FE: sale_year | X | X | X | X |
This version uses the ordinal Flood Factor model and estimates the post-release contrast separately for each Flood Factor score.
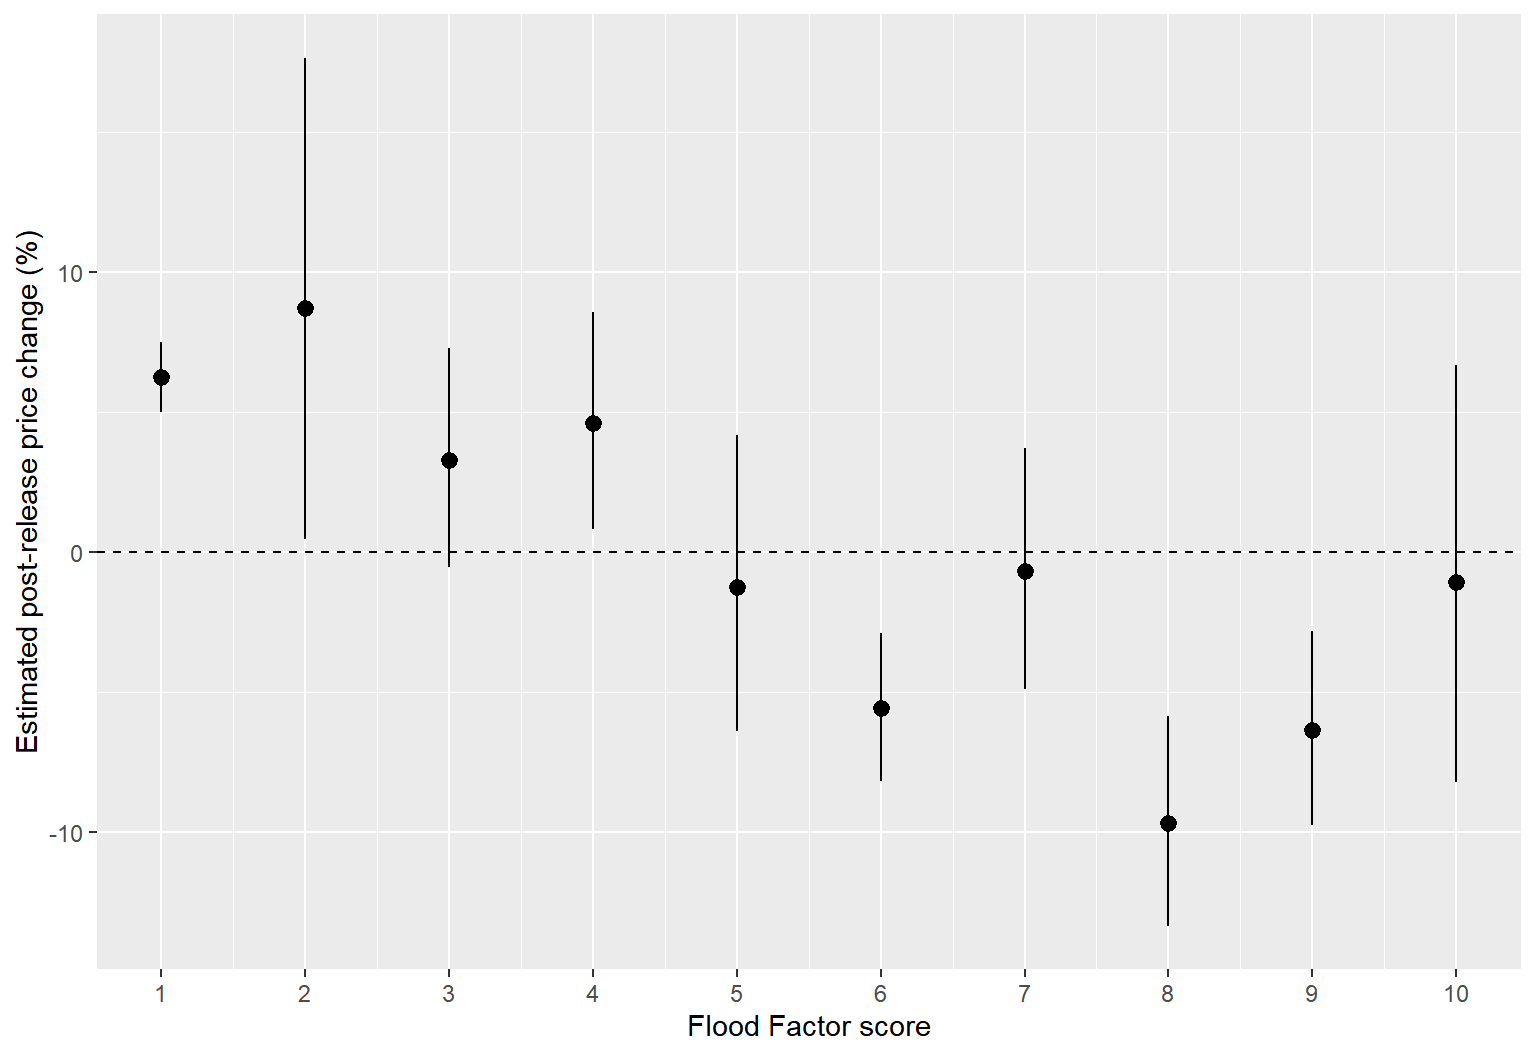
| ff_score_ord | estimate | std.error | conf.low | conf.high | pct_change | pct_low | pct_high | p.value |
|---|---|---|---|---|---|---|---|---|
| 1 | 0.06 | 0.01 | 0.05 | 0.07 | 6.24 | 5.01 | 7.49 | 0.00 |
| 2 | 0.08 | 0.04 | 0.00 | 0.16 | 8.73 | 0.47 | 17.67 | 0.04 |
| 3 | 0.03 | 0.02 | -0.01 | 0.07 | 3.30 | -0.54 | 7.28 | 0.09 |
| 4 | 0.05 | 0.02 | 0.01 | 0.08 | 4.62 | 0.81 | 8.57 | 0.02 |
| 5 | -0.01 | 0.03 | -0.07 | 0.04 | -1.25 | -6.40 | 4.19 | 0.65 |
| 6 | -0.06 | 0.01 | -0.09 | -0.03 | -5.57 | -8.17 | -2.89 | 0.00 |
| 7 | -0.01 | 0.02 | -0.05 | 0.04 | -0.70 | -4.92 | 3.71 | 0.75 |
| 8 | -0.10 | 0.02 | -0.14 | -0.06 | -9.70 | -13.37 | -5.87 | 0.00 |
| 9 | -0.07 | 0.02 | -0.10 | -0.03 | -6.35 | -9.75 | -2.82 | 0.00 |
| 10 | -0.01 | 0.04 | -0.09 | 0.06 | -1.06 | -8.24 | 6.67 | 0.78 |
This version tests whether the ordinal Flood Factor information effect differs by FEMA SFHA status. This is the most relevant robustness check if the core question is whether Flood Factor provided new information beyond FEMA floodplain designation.
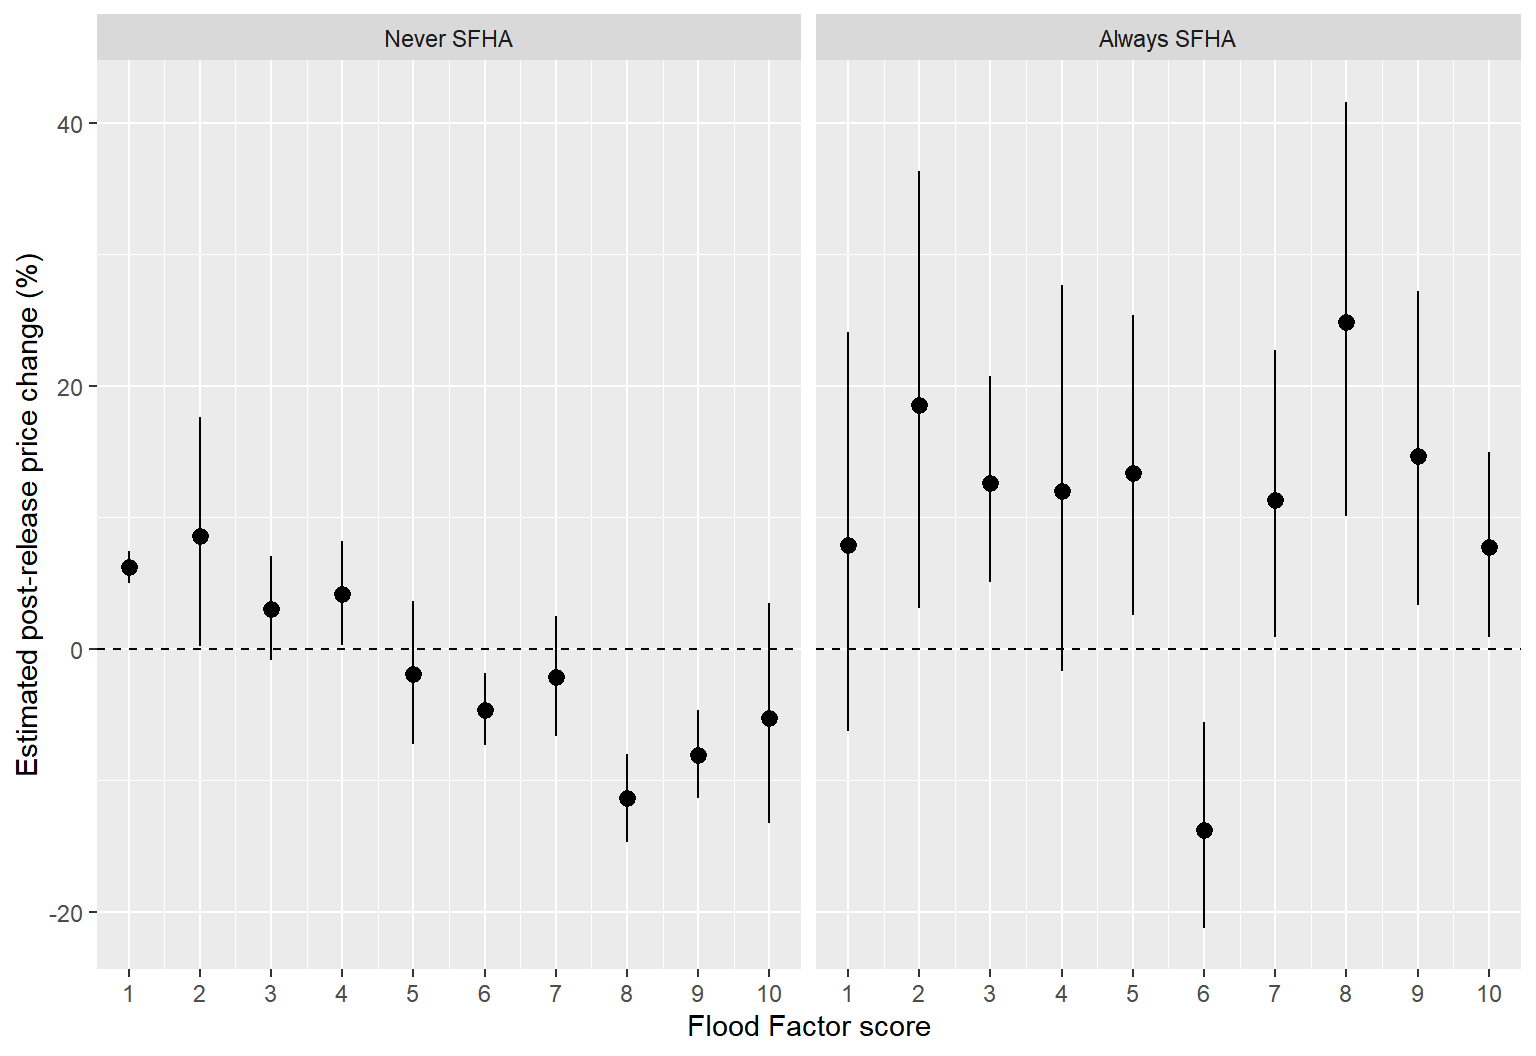
| change_type | ff_score_ord | estimate | std.error | conf.low | conf.high | pct_change | pct_low | pct_high | p.value |
|---|---|---|---|---|---|---|---|---|---|
| Never SFHA | 1 | 0.06 | 0.01 | 0.05 | 0.07 | 6.21 | 4.98 | 7.47 | 0.00 |
| Never SFHA | 2 | 0.08 | 0.04 | 0.00 | 0.16 | 8.54 | 0.18 | 17.60 | 0.04 |
| Never SFHA | 3 | 0.03 | 0.02 | -0.01 | 0.07 | 3.02 | -0.88 | 7.08 | 0.13 |
| Never SFHA | 4 | 0.04 | 0.02 | 0.00 | 0.08 | 4.15 | 0.25 | 8.20 | 0.04 |
| Never SFHA | 5 | -0.02 | 0.03 | -0.07 | 0.04 | -1.94 | -7.21 | 3.62 | 0.49 |
| Never SFHA | 6 | -0.05 | 0.01 | -0.08 | -0.02 | -4.62 | -7.33 | -1.83 | 0.00 |
| Never SFHA | 7 | -0.02 | 0.02 | -0.07 | 0.02 | -2.18 | -6.63 | 2.49 | 0.35 |
| Never SFHA | 8 | -0.12 | 0.02 | -0.16 | -0.08 | -11.38 | -14.67 | -7.96 | 0.00 |
| Never SFHA | 9 | -0.08 | 0.02 | -0.12 | -0.05 | -8.08 | -11.36 | -4.67 | 0.00 |
| Never SFHA | 10 | -0.05 | 0.05 | -0.14 | 0.03 | -5.28 | -13.28 | 3.47 | 0.23 |
| Always SFHA | 1 | 0.08 | 0.07 | -0.06 | 0.22 | 7.86 | -6.27 | 24.11 | 0.29 |
| Always SFHA | 2 | 0.17 | 0.07 | 0.03 | 0.31 | 18.56 | 3.08 | 36.36 | 0.02 |
| Always SFHA | 3 | 0.12 | 0.04 | 0.05 | 0.19 | 12.61 | 5.06 | 20.71 | 0.00 |
| Always SFHA | 4 | 0.11 | 0.07 | -0.02 | 0.24 | 12.01 | -1.71 | 27.66 | 0.09 |
| Always SFHA | 5 | 0.13 | 0.05 | 0.03 | 0.23 | 13.40 | 2.56 | 25.38 | 0.01 |
| Always SFHA | 6 | -0.15 | 0.05 | -0.24 | -0.06 | -13.75 | -21.24 | -5.55 | 0.00 |
| Always SFHA | 7 | 0.11 | 0.05 | 0.01 | 0.20 | 11.29 | 0.92 | 22.73 | 0.03 |
| Always SFHA | 8 | 0.22 | 0.06 | 0.10 | 0.35 | 24.88 | 10.13 | 41.60 | 0.00 |
| Always SFHA | 9 | 0.14 | 0.05 | 0.03 | 0.24 | 14.66 | 3.33 | 27.23 | 0.01 |
| Always SFHA | 10 | 0.07 | 0.03 | 0.01 | 0.14 | 7.71 | 0.91 | 14.96 | 0.03 |
This version checks whether the ordinal Flood Factor information effect differs across Cook County regions.
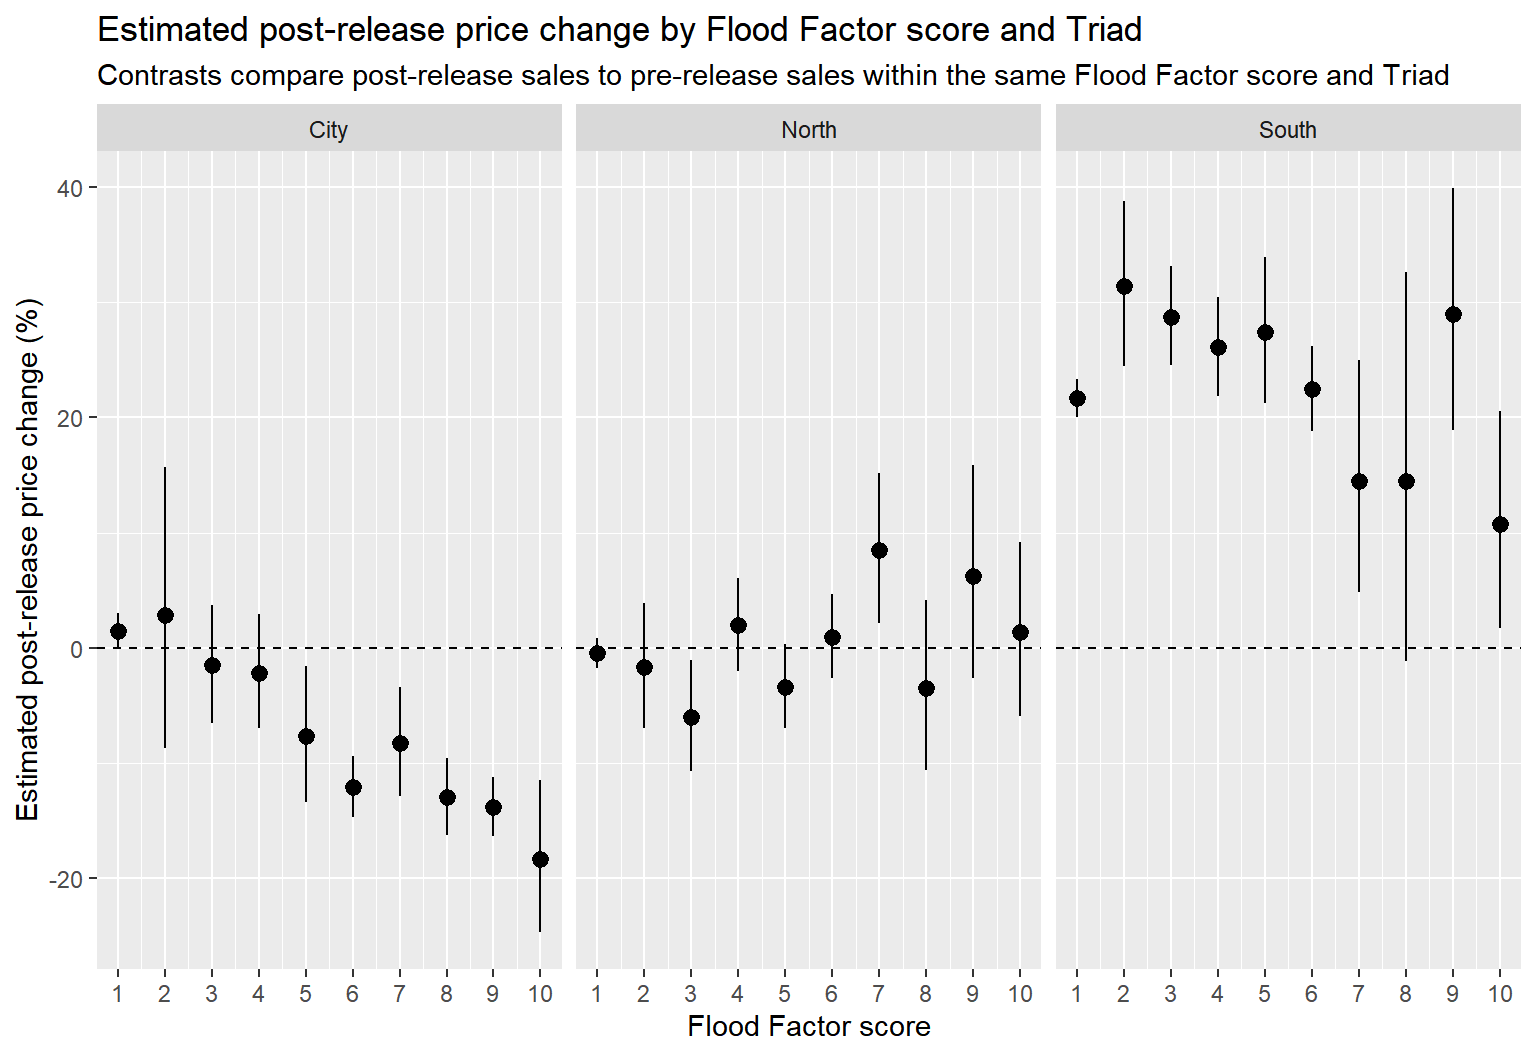
| Triad | ff_score_ord | estimate | std.error | conf.low | conf.high | pct_change | pct_low | pct_high | p.value |
|---|---|---|---|---|---|---|---|---|---|
| City | 1 | 0.01 | 0.01 | 0.00 | 0.03 | 1.49 | 0.00 | 2.99 | 0.05 |
| City | 2 | 0.03 | 0.06 | -0.09 | 0.15 | 2.81 | -8.65 | 15.71 | 0.65 |
| City | 3 | -0.02 | 0.03 | -0.07 | 0.04 | -1.52 | -6.48 | 3.71 | 0.56 |
| City | 4 | -0.02 | 0.03 | -0.07 | 0.03 | -2.15 | -6.96 | 2.90 | 0.40 |
| City | 5 | -0.08 | 0.03 | -0.14 | -0.02 | -7.69 | -13.41 | -1.60 | 0.01 |
| City | 6 | -0.13 | 0.02 | -0.16 | -0.10 | -12.08 | -14.71 | -9.38 | 0.00 |
| City | 7 | -0.09 | 0.03 | -0.14 | -0.03 | -8.27 | -12.89 | -3.41 | 0.00 |
| City | 8 | -0.14 | 0.02 | -0.18 | -0.10 | -12.96 | -16.23 | -9.57 | 0.00 |
| City | 9 | -0.15 | 0.02 | -0.18 | -0.12 | -13.81 | -16.36 | -11.17 | 0.00 |
| City | 10 | -0.20 | 0.04 | -0.28 | -0.12 | -18.35 | -24.68 | -11.50 | 0.00 |
| North | 1 | -0.00 | 0.01 | -0.02 | 0.01 | -0.48 | -1.79 | 0.84 | 0.47 |
| North | 2 | -0.02 | 0.03 | -0.07 | 0.04 | -1.69 | -6.96 | 3.88 | 0.54 |
| North | 3 | -0.06 | 0.03 | -0.11 | -0.01 | -5.97 | -10.66 | -1.03 | 0.02 |
| North | 4 | 0.02 | 0.02 | -0.02 | 0.06 | 1.99 | -1.97 | 6.10 | 0.33 |
| North | 5 | -0.03 | 0.02 | -0.07 | 0.00 | -3.40 | -6.95 | 0.30 | 0.07 |
| North | 6 | 0.01 | 0.02 | -0.03 | 0.05 | 0.96 | -2.65 | 4.71 | 0.61 |
| North | 7 | 0.08 | 0.03 | 0.02 | 0.14 | 8.49 | 2.17 | 15.20 | 0.01 |
| North | 8 | -0.04 | 0.04 | -0.11 | 0.04 | -3.51 | -10.64 | 4.18 | 0.36 |
| North | 9 | 0.06 | 0.04 | -0.03 | 0.15 | 6.22 | -2.61 | 15.86 | 0.17 |
| North | 10 | 0.01 | 0.04 | -0.06 | 0.09 | 1.37 | -5.88 | 9.18 | 0.72 |
| South | 1 | 0.20 | 0.01 | 0.18 | 0.21 | 21.64 | 20.00 | 23.31 | 0.00 |
| South | 2 | 0.27 | 0.03 | 0.22 | 0.33 | 31.41 | 24.43 | 38.78 | 0.00 |
| South | 3 | 0.25 | 0.02 | 0.22 | 0.29 | 28.74 | 24.52 | 33.10 | 0.00 |
| South | 4 | 0.23 | 0.02 | 0.20 | 0.27 | 26.07 | 21.84 | 30.45 | 0.00 |
| South | 5 | 0.24 | 0.03 | 0.19 | 0.29 | 27.40 | 21.21 | 33.92 | 0.00 |
| South | 6 | 0.20 | 0.02 | 0.17 | 0.23 | 22.47 | 18.85 | 26.21 | 0.00 |
| South | 7 | 0.14 | 0.04 | 0.05 | 0.22 | 14.45 | 4.81 | 24.98 | 0.00 |
| South | 8 | 0.14 | 0.08 | -0.01 | 0.28 | 14.49 | -1.17 | 32.64 | 0.07 |
| South | 9 | 0.25 | 0.04 | 0.17 | 0.34 | 28.97 | 18.90 | 39.91 | 0.00 |
| South | 10 | 0.10 | 0.04 | 0.02 | 0.19 | 10.72 | 1.69 | 20.56 | 0.02 |
This model is highly saturated and is best treated as appendix or diagnostic material. It checks whether the ordinal Flood Factor information effect varies jointly by FEMA SFHA status and Cook County region.
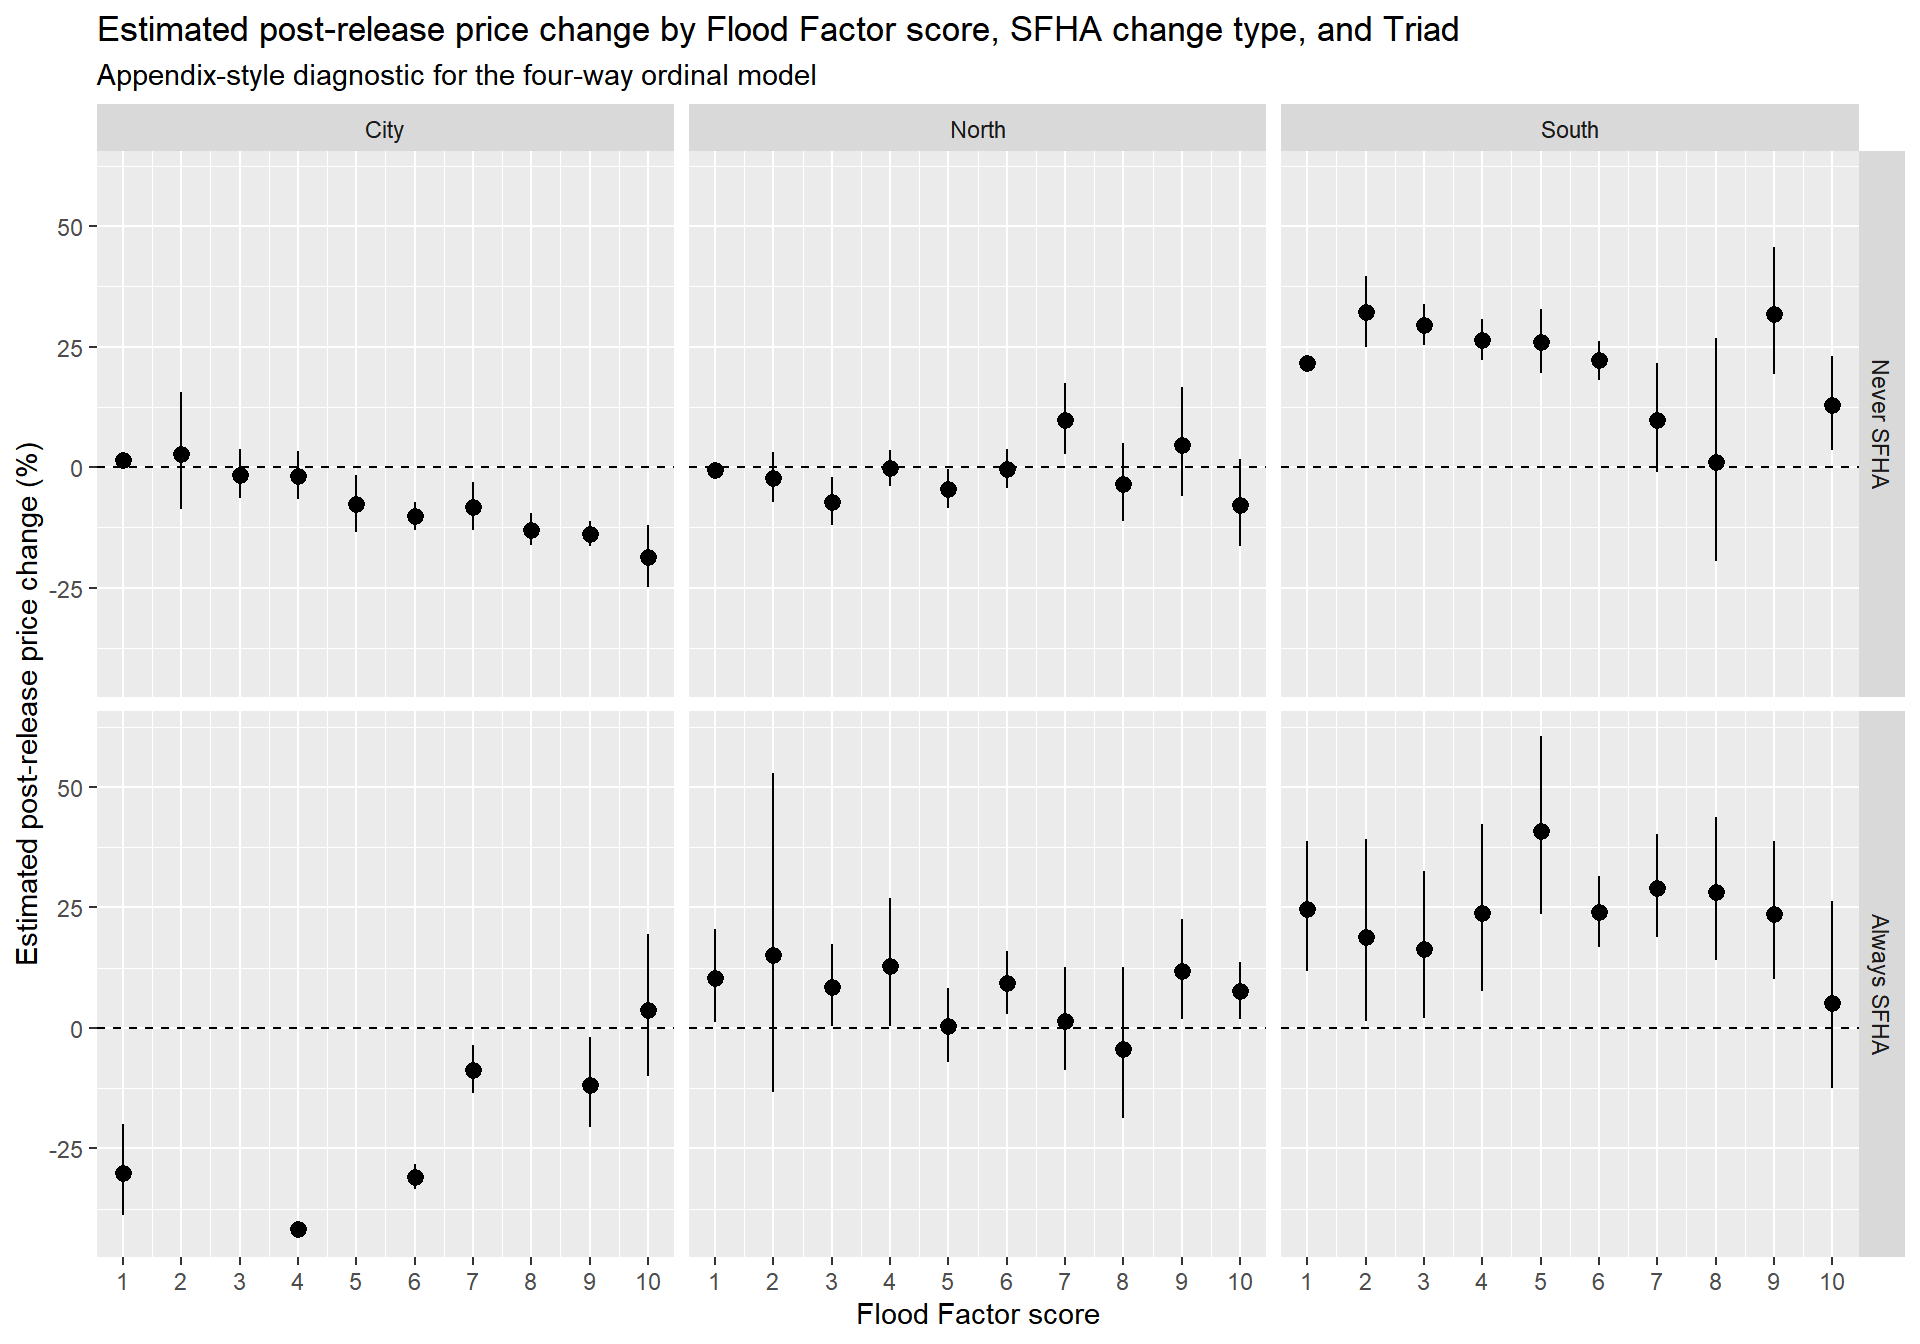
| change_type | Triad | ff_score_ord | estimate | std.error | conf.low | conf.high | pct_change | pct_low | pct_high | p.value |
|---|---|---|---|---|---|---|---|---|---|---|
| Never SFHA | City | 1 | 0.02 | 0.01 | 0.00 | 0.03 | 1.52 | 0.03 | 3.03 | 0.05 |
| Never SFHA | City | 2 | 0.03 | 0.06 | -0.09 | 0.15 | 2.79 | -8.67 | 15.68 | 0.65 |
| Never SFHA | City | 3 | -0.02 | 0.03 | -0.07 | 0.04 | -1.54 | -6.50 | 3.69 | 0.56 |
| Never SFHA | City | 4 | -0.02 | 0.03 | -0.07 | 0.03 | -1.78 | -6.63 | 3.31 | 0.49 |
| Never SFHA | City | 5 | -0.08 | 0.03 | -0.14 | -0.02 | -7.71 | -13.42 | -1.62 | 0.01 |
| Never SFHA | City | 6 | -0.11 | 0.02 | -0.14 | -0.08 | -10.19 | -13.01 | -7.27 | 0.00 |
| Never SFHA | City | 7 | -0.09 | 0.03 | -0.14 | -0.03 | -8.26 | -13.14 | -3.11 | 0.00 |
| Never SFHA | City | 8 | -0.14 | 0.02 | -0.18 | -0.10 | -12.98 | -16.25 | -9.59 | 0.00 |
| Never SFHA | City | 9 | -0.15 | 0.02 | -0.18 | -0.12 | -13.86 | -16.45 | -11.19 | 0.00 |
| Never SFHA | City | 10 | -0.21 | 0.04 | -0.29 | -0.13 | -18.69 | -24.90 | -11.97 | 0.00 |
| Never SFHA | North | 1 | -0.01 | 0.01 | -0.02 | 0.01 | -0.63 | -1.93 | 0.69 | 0.35 |
| Never SFHA | North | 2 | -0.02 | 0.03 | -0.08 | 0.03 | -2.24 | -7.33 | 3.12 | 0.41 |
| Never SFHA | North | 3 | -0.07 | 0.03 | -0.13 | -0.02 | -7.19 | -12.00 | -2.12 | 0.01 |
| Never SFHA | North | 4 | -0.00 | 0.02 | -0.04 | 0.04 | -0.19 | -3.86 | 3.62 | 0.92 |
| Never SFHA | North | 5 | -0.05 | 0.02 | -0.09 | -0.00 | -4.53 | -8.53 | -0.36 | 0.03 |
| Never SFHA | North | 6 | -0.00 | 0.02 | -0.04 | 0.04 | -0.34 | -4.22 | 3.71 | 0.87 |
| Never SFHA | North | 7 | 0.09 | 0.03 | 0.03 | 0.16 | 9.77 | 2.67 | 17.37 | 0.01 |
| Never SFHA | North | 8 | -0.03 | 0.04 | -0.12 | 0.05 | -3.40 | -11.23 | 5.11 | 0.42 |
| Never SFHA | North | 9 | 0.05 | 0.06 | -0.06 | 0.15 | 4.69 | -6.06 | 16.68 | 0.41 |
| Never SFHA | North | 10 | -0.08 | 0.05 | -0.18 | 0.02 | -7.77 | -16.33 | 1.67 | 0.10 |
| Never SFHA | South | 1 | 0.20 | 0.01 | 0.18 | 0.21 | 21.60 | 19.95 | 23.26 | 0.00 |
| Never SFHA | South | 2 | 0.28 | 0.03 | 0.22 | 0.33 | 32.10 | 24.87 | 39.76 | 0.00 |
| Never SFHA | South | 3 | 0.26 | 0.02 | 0.23 | 0.29 | 29.60 | 25.40 | 33.95 | 0.00 |
| Never SFHA | South | 4 | 0.23 | 0.02 | 0.20 | 0.27 | 26.35 | 22.20 | 30.65 | 0.00 |
| Never SFHA | South | 5 | 0.23 | 0.03 | 0.18 | 0.28 | 26.02 | 19.50 | 32.91 | 0.00 |
| Never SFHA | South | 6 | 0.20 | 0.02 | 0.17 | 0.23 | 22.14 | 18.16 | 26.26 | 0.00 |
| Never SFHA | South | 7 | 0.09 | 0.05 | -0.01 | 0.20 | 9.71 | -1.03 | 21.62 | 0.08 |
| Never SFHA | South | 8 | 0.01 | 0.12 | -0.22 | 0.24 | 0.99 | -19.53 | 26.74 | 0.93 |
| Never SFHA | South | 9 | 0.28 | 0.05 | 0.18 | 0.38 | 31.87 | 19.35 | 45.70 | 0.00 |
| Never SFHA | South | 10 | 0.12 | 0.04 | 0.03 | 0.21 | 12.83 | 3.47 | 23.03 | 0.01 |
| Always SFHA | City | 1 | -0.36 | 0.07 | -0.49 | -0.22 | -30.09 | -38.91 | -20.00 | 0.00 |
| Always SFHA | City | 4 | -0.54 | 0.01 | -0.55 | -0.53 | -41.77 | -42.50 | -41.04 | 0.00 |
| Always SFHA | City | 6 | -0.37 | 0.02 | -0.41 | -0.33 | -30.88 | -33.45 | -28.21 | 0.00 |
| Always SFHA | City | 7 | -0.09 | 0.03 | -0.14 | -0.04 | -8.70 | -13.49 | -3.65 | 0.00 |
| Always SFHA | City | 9 | -0.13 | 0.05 | -0.23 | -0.02 | -11.82 | -20.68 | -1.96 | 0.02 |
| Always SFHA | City | 10 | 0.04 | 0.07 | -0.11 | 0.18 | 3.66 | -10.05 | 19.46 | 0.62 |
| Always SFHA | North | 1 | 0.10 | 0.04 | 0.01 | 0.19 | 10.40 | 1.17 | 20.48 | 0.03 |
| Always SFHA | North | 2 | 0.14 | 0.14 | -0.14 | 0.42 | 15.12 | -13.27 | 52.81 | 0.33 |
| Always SFHA | North | 3 | 0.08 | 0.04 | 0.00 | 0.16 | 8.57 | 0.33 | 17.48 | 0.04 |
| Always SFHA | North | 4 | 0.12 | 0.06 | 0.00 | 0.24 | 12.84 | 0.28 | 26.97 | 0.04 |
| Always SFHA | North | 5 | 0.00 | 0.04 | -0.07 | 0.08 | 0.35 | -7.08 | 8.37 | 0.93 |
| Always SFHA | North | 6 | 0.09 | 0.03 | 0.03 | 0.15 | 9.28 | 2.91 | 16.03 | 0.00 |
| Always SFHA | North | 7 | 0.01 | 0.05 | -0.09 | 0.12 | 1.35 | -8.76 | 12.59 | 0.80 |
| Always SFHA | North | 8 | -0.04 | 0.08 | -0.21 | 0.12 | -4.38 | -18.81 | 12.61 | 0.59 |
| Always SFHA | North | 9 | 0.11 | 0.05 | 0.02 | 0.20 | 11.69 | 1.84 | 22.49 | 0.02 |
| Always SFHA | North | 10 | 0.07 | 0.03 | 0.02 | 0.13 | 7.62 | 1.91 | 13.65 | 0.01 |
| Always SFHA | South | 1 | 0.22 | 0.06 | 0.11 | 0.33 | 24.59 | 11.82 | 38.81 | 0.00 |
| Always SFHA | South | 2 | 0.17 | 0.08 | 0.01 | 0.33 | 18.81 | 1.39 | 39.22 | 0.03 |
| Always SFHA | South | 3 | 0.15 | 0.07 | 0.02 | 0.28 | 16.39 | 2.12 | 32.65 | 0.02 |
| Always SFHA | South | 4 | 0.21 | 0.07 | 0.07 | 0.35 | 23.75 | 7.56 | 42.38 | 0.00 |
| Always SFHA | South | 5 | 0.34 | 0.07 | 0.21 | 0.47 | 40.85 | 23.58 | 60.52 | 0.00 |
| Always SFHA | South | 6 | 0.21 | 0.03 | 0.16 | 0.27 | 23.95 | 16.80 | 31.52 | 0.00 |
| Always SFHA | South | 7 | 0.26 | 0.04 | 0.17 | 0.34 | 29.07 | 18.80 | 40.22 | 0.00 |
| Always SFHA | South | 8 | 0.25 | 0.06 | 0.13 | 0.36 | 28.11 | 14.14 | 43.80 | 0.00 |
| Always SFHA | South | 9 | 0.21 | 0.06 | 0.10 | 0.33 | 23.57 | 10.12 | 38.68 | 0.00 |
| Always SFHA | South | 10 | 0.05 | 0.09 | -0.13 | 0.23 | 5.20 | -12.45 | 26.41 | 0.59 |
The following table identifies coefficients omitted from interpretation due to extremely large standard errors or lack of identification under the fixed-effects structure. Large standard errors typically indicate that a coefficient is not identified within the property fixed-effects framework because the underlying variable does not vary within parcels over time, or because certain interaction combinations contain extremely sparse observations.
Continuous Flood Factor Models
With property and year fixed effects, the continuous Flood Factor models do not estimate whether higher-score properties are generally cheaper than lower-score properties. That cross-sectional difference is absorbed by the property fixed effects. Instead, these models test whether post-release price trajectories differed systematically for properties with different Flood Factor scores.
The coefficient on env_flood_fs_factor:event is best interpreted as whether properties with higher Flood Factor scores had more negative post-release price changes than properties with lower Flood Factor scores, net of property and year fixed effects.
| Continuous | Continuous × Triad | Change Type × Continuous × Event × Triad | Change Type × Continuous × Event | |
|---|---|---|---|---|
| eventTRUE | 0.080*** | 0.041*** | 0.039*** | 0.081*** |
| (0.007) | (0.009) | (0.009) | (0.007) | |
| env_flood_fs_factor × eventTRUE | -0.018*** | -0.024*** | -0.022*** | -0.019*** |
| (0.002) | (0.002) | (0.002) | (0.002) | |
| eventTRUE × TriadNorth | -0.051*** | -0.047*** | ||
| (0.010) | (0.010) | |||
| eventTRUE × TriadSouth | 0.157*** | 0.158*** | ||
| (0.010) | (0.010) | |||
| env_flood_fs_factor × eventTRUE × TriadNorth | 0.027*** | 0.021*** | ||
| (0.003) | (0.004) | |||
| env_flood_fs_factor × eventTRUE × TriadSouth | 0.026*** | 0.024*** | ||
| (0.003) | (0.003) | |||
| change_typeAlways SFHA × eventTRUE | -0.511*** | -0.003 | ||
| (0.052) | (0.059) | |||
| change_typeChanges SFHA × eventTRUE | -0.099 | 0.024 | ||
| (0.062) | (0.062) | |||
| change_typeAlways SFHA × env_flood_fs_factor × eventTRUE | 0.043*** | 0.002 | ||
| (0.010) | (0.011) | |||
| change_typeChanges SFHA × env_flood_fs_factor × eventTRUE | 0.033 | 0.054** | ||
| (0.021) | (0.021) | |||
| change_typeAlways SFHA × eventTRUE × TriadNorth | 0.622*** | |||
| (0.065) | ||||
| change_typeAlways SFHA × eventTRUE × TriadSouth | 0.539*** | |||
| (0.073) | ||||
| change_typeAlways SFHA × env_flood_fs_factor × eventTRUE × TriadNorth | -0.046*** | |||
| (0.012) | ||||
| change_typeAlways SFHA × env_flood_fs_factor × eventTRUE × TriadSouth | -0.047*** | |||
| (0.013) | ||||
| Num.Obs. | 666564 | 666564 | 666564 | 666564 |
| R2 | 0.859 | 0.861 | 0.861 | 0.859 |
| R2 Within | 0.002 | 0.012 | 0.013 | 0.002 |
| Std.Errors | by: pin10 | by: pin10 | by: pin10 | by: pin10 |
| FE: pin | X | X | X | X |
| FE: sale_year | X | X | X | X |
This estimates the post-release marginal association between one additional Flood Factor point and sale price. This is a slope interpretation: it asks whether higher-score properties had more negative post-release price trajectories.
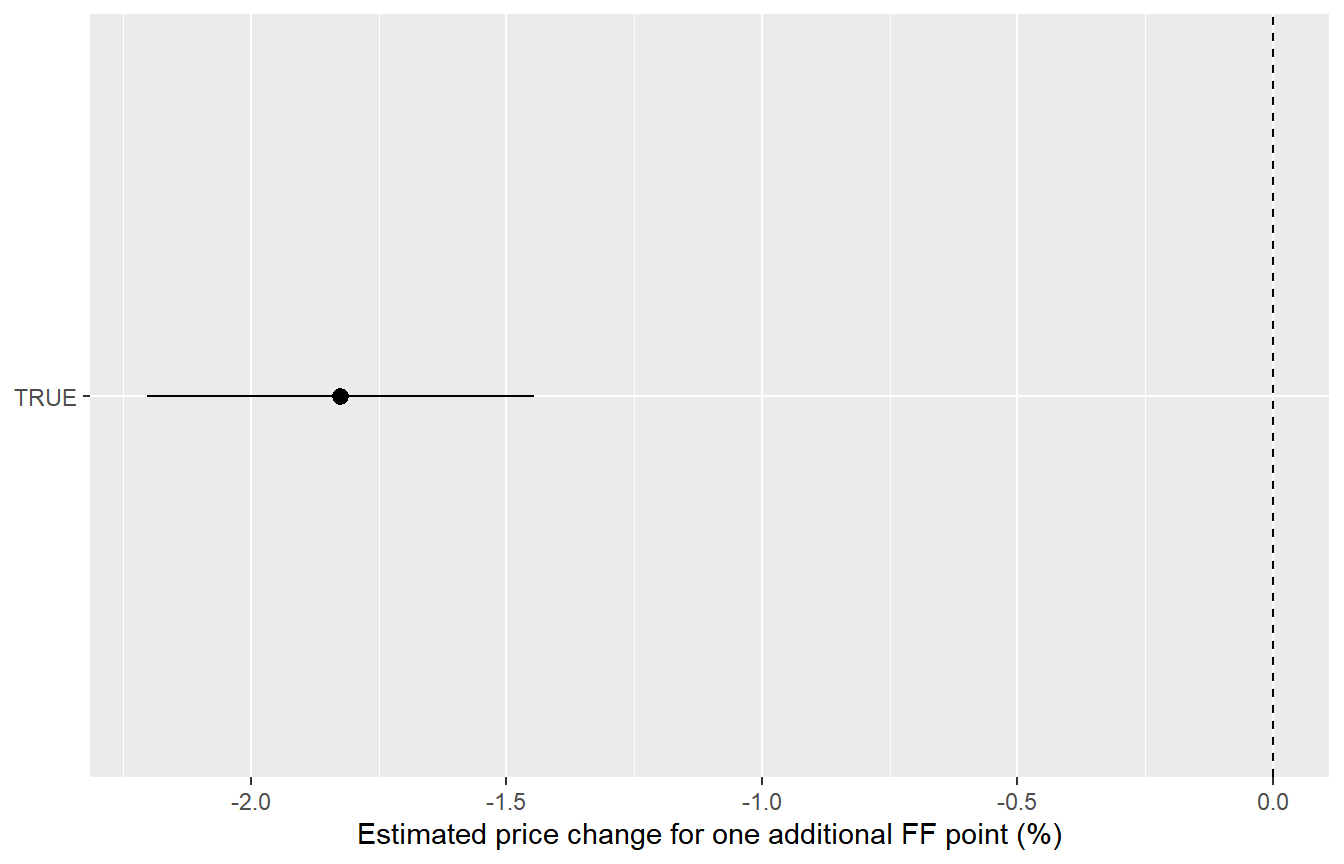
| event | estimate | std.error | conf.low | conf.high | pct_change | pct_low | pct_high | p.value |
|---|---|---|---|---|---|---|---|---|
| TRUE | -0.02 | 0.00 | -0.02 | -0.01 | -1.83 | -2.20 | -1.45 | 0.00 |
This version estimates whether the post-release slope of Flood Factor score differs across Cook County regions.
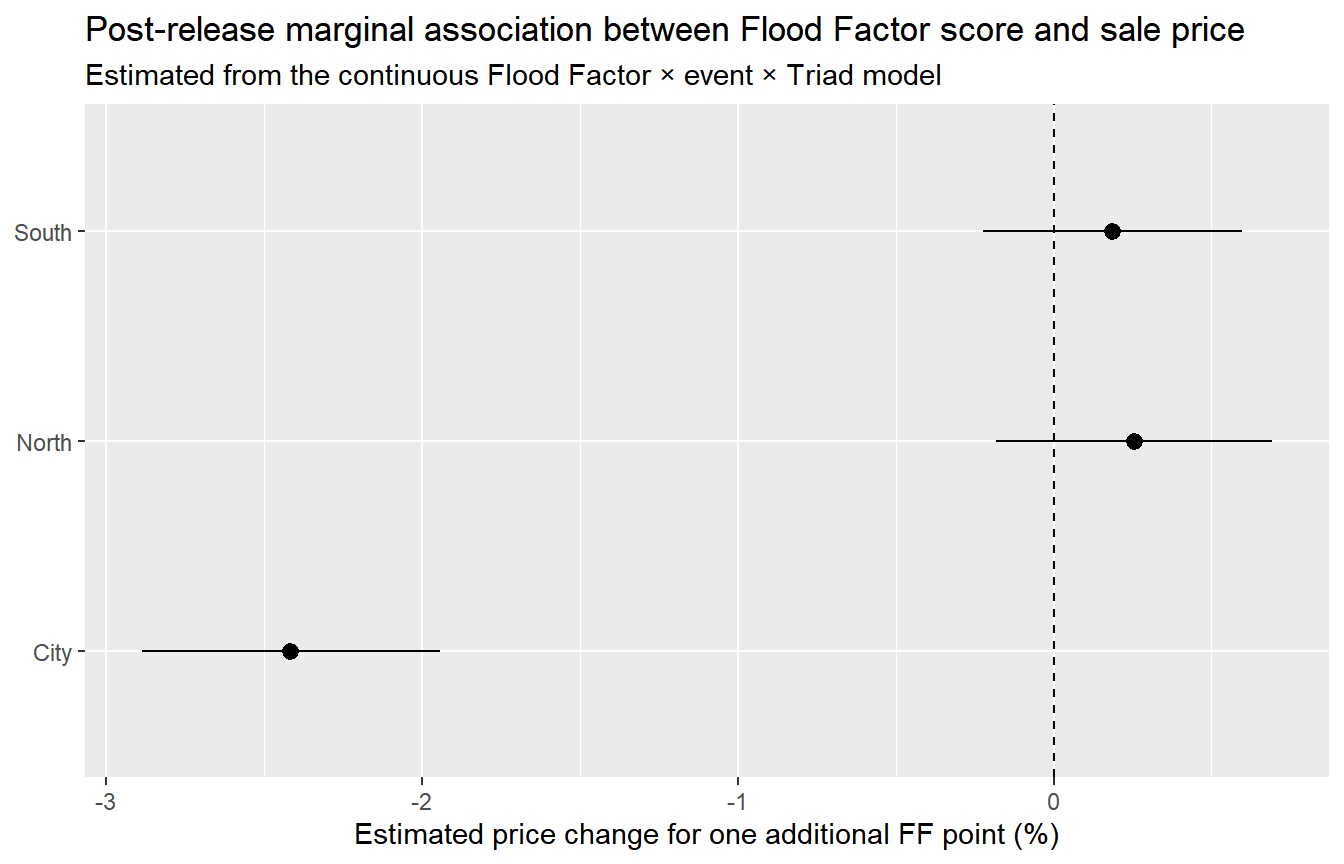
| Triad | estimate | std.error | conf.low | conf.high | pct_change | pct_low | pct_high | p.value |
|---|---|---|---|---|---|---|---|---|
| City | -0.02 | 0.00 | -0.03 | -0.02 | -2.42 | -2.89 | -1.94 | 0.00 |
| North | 0.00 | 0.00 | -0.00 | 0.01 | 0.25 | -0.18 | 0.69 | 0.25 |
| South | 0.00 | 0.00 | -0.00 | 0.01 | 0.19 | -0.22 | 0.60 | 0.38 |
This is not the same estimand as the one-point Flood Factor slope above. This version estimates the post-release contrast at each Flood Factor score and Triad. Use it as a dose-response-style visualization of the information release effect.
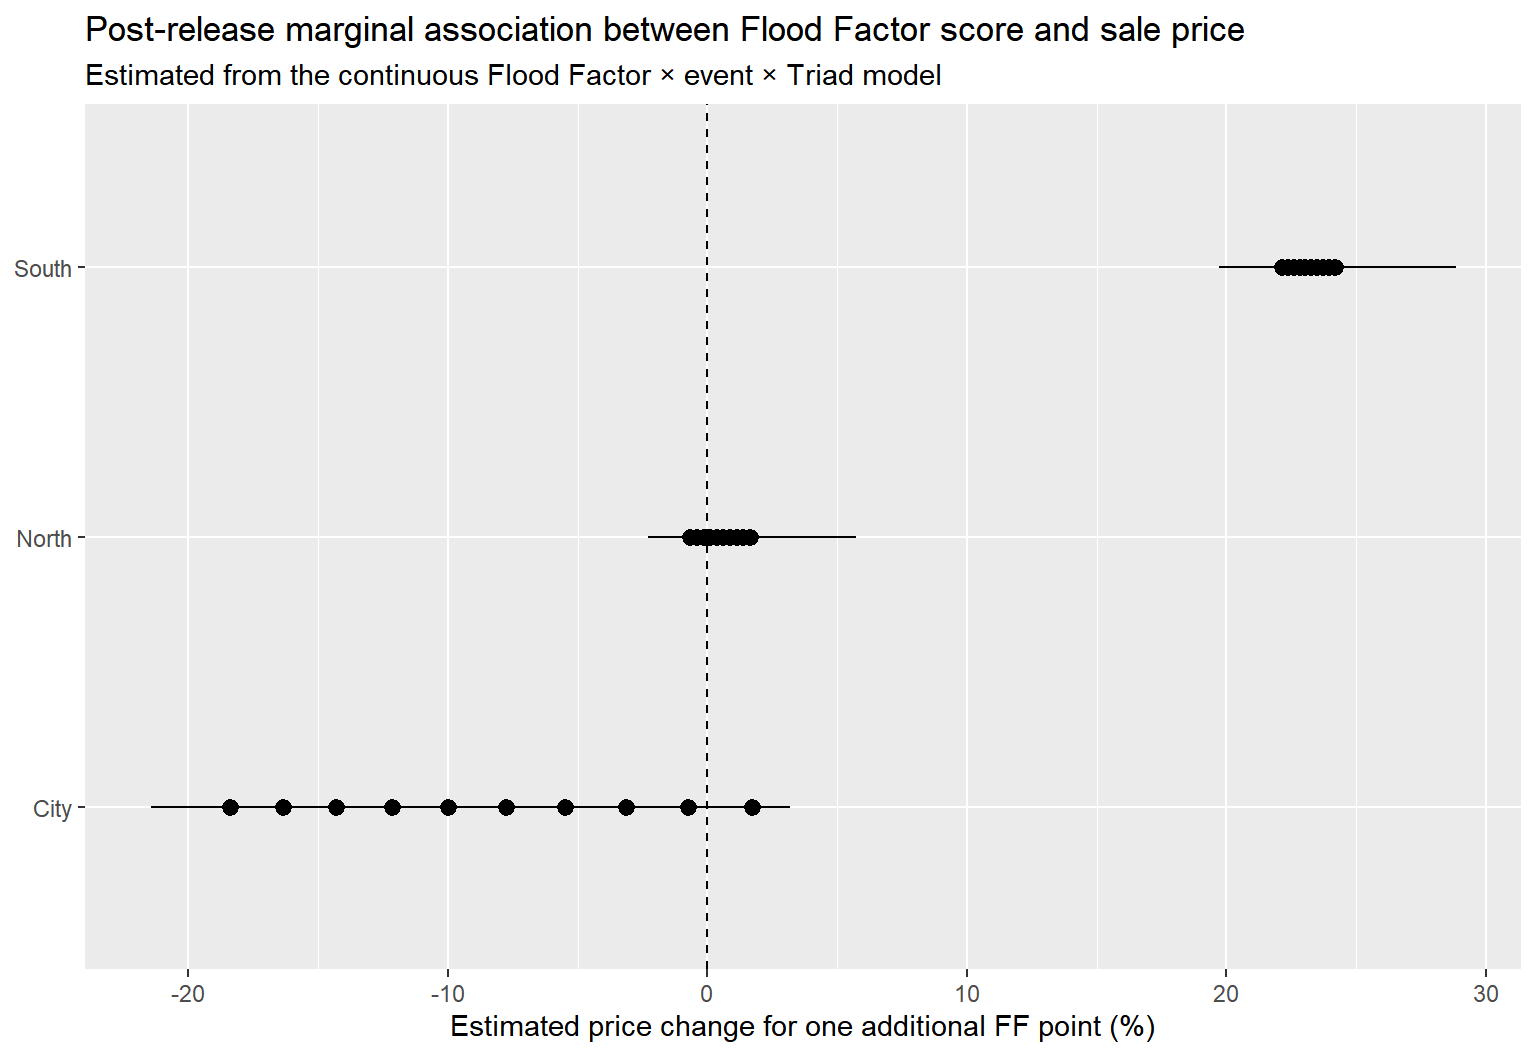
| term | contrast | env_flood_fs_factor | Triad | estimate | std.error | statistic | p.value | s.value | conf.low | conf.high | pct_change | pct_low | pct_high |
|---|---|---|---|---|---|---|---|---|---|---|---|---|---|
| event | TRUE - FALSE | 1.00 | City | 0.02 | 0.01 | 2.34 | 0.02 | 5.72 | 0.00 | 0.03 | 1.71 | 0.28 | 3.17 |
| event | TRUE - FALSE | 2.00 | City | -0.01 | 0.01 | -1.18 | 0.24 | 2.07 | -0.02 | 0.00 | -0.75 | -1.97 | 0.50 |
| event | TRUE - FALSE | 3.00 | City | -0.03 | 0.01 | -5.03 | 0.00 | 20.98 | -0.04 | -0.02 | -3.15 | -4.34 | -1.93 |
| event | TRUE - FALSE | 4.00 | City | -0.06 | 0.01 | -7.78 | 0.00 | 46.94 | -0.07 | -0.04 | -5.49 | -6.82 | -4.13 |
| event | TRUE - FALSE | 5.00 | City | -0.08 | 0.01 | -9.21 | 0.00 | 64.72 | -0.10 | -0.06 | -7.77 | -9.35 | -6.17 |
| event | TRUE - FALSE | 6.00 | City | -0.11 | 0.01 | -9.87 | 0.00 | 73.94 | -0.13 | -0.08 | -10.00 | -11.86 | -8.10 |
| event | TRUE - FALSE | 7.00 | City | -0.13 | 0.01 | -10.17 | 0.00 | 78.34 | -0.15 | -0.10 | -12.18 | -14.35 | -9.95 |
| event | TRUE - FALSE | 8.00 | City | -0.15 | 0.01 | -10.31 | 0.00 | 80.36 | -0.18 | -0.12 | -14.30 | -16.78 | -11.75 |
| event | TRUE - FALSE | 9.00 | City | -0.18 | 0.02 | -10.37 | 0.00 | 81.22 | -0.21 | -0.14 | -16.37 | -19.15 | -13.50 |
| event | TRUE - FALSE | 10.00 | City | -0.20 | 0.02 | -10.38 | 0.00 | 81.50 | -0.24 | -0.16 | -18.39 | -21.46 | -15.20 |
| event | TRUE - FALSE | 1.00 | North | -0.01 | 0.01 | -0.98 | 0.33 | 1.61 | -0.02 | 0.01 | -0.65 | -1.95 | 0.66 |
| event | TRUE - FALSE | 2.00 | North | -0.00 | 0.01 | -0.60 | 0.55 | 0.86 | -0.02 | 0.01 | -0.40 | -1.71 | 0.92 |
| event | TRUE - FALSE | 3.00 | North | -0.00 | 0.01 | -0.20 | 0.84 | 0.25 | -0.02 | 0.01 | -0.15 | -1.59 | 1.32 |
| event | TRUE - FALSE | 4.00 | North | 0.00 | 0.01 | 0.12 | 0.90 | 0.15 | -0.02 | 0.02 | 0.11 | -1.58 | 1.82 |
| event | TRUE - FALSE | 5.00 | North | 0.00 | 0.01 | 0.35 | 0.73 | 0.46 | -0.02 | 0.02 | 0.36 | -1.63 | 2.40 |
| event | TRUE - FALSE | 6.00 | North | 0.01 | 0.01 | 0.51 | 0.61 | 0.71 | -0.02 | 0.03 | 0.62 | -1.73 | 3.02 |
| event | TRUE - FALSE | 7.00 | North | 0.01 | 0.01 | 0.62 | 0.53 | 0.91 | -0.02 | 0.04 | 0.87 | -1.85 | 3.67 |
| event | TRUE - FALSE | 8.00 | North | 0.01 | 0.02 | 0.70 | 0.48 | 1.06 | -0.02 | 0.04 | 1.13 | -1.98 | 4.34 |
| event | TRUE - FALSE | 9.00 | North | 0.01 | 0.02 | 0.77 | 0.44 | 1.17 | -0.02 | 0.05 | 1.39 | -2.12 | 5.03 |
| event | TRUE - FALSE | 10.00 | North | 0.02 | 0.02 | 0.81 | 0.42 | 1.26 | -0.02 | 0.06 | 1.65 | -2.28 | 5.72 |
| event | TRUE - FALSE | 1.00 | South | 0.20 | 0.01 | 28.92 | 0.00 | 608.57 | 0.19 | 0.21 | 22.14 | 20.49 | 23.80 |
| event | TRUE - FALSE | 2.00 | South | 0.20 | 0.01 | 29.58 | 0.00 | 636.47 | 0.19 | 0.22 | 22.36 | 20.74 | 24.01 |
| event | TRUE - FALSE | 3.00 | South | 0.20 | 0.01 | 27.71 | 0.00 | 559.10 | 0.19 | 0.22 | 22.59 | 20.84 | 24.37 |
| event | TRUE - FALSE | 4.00 | South | 0.21 | 0.01 | 24.53 | 0.00 | 438.89 | 0.19 | 0.22 | 22.82 | 20.82 | 24.85 |
| event | TRUE - FALSE | 5.00 | South | 0.21 | 0.01 | 21.26 | 0.00 | 330.77 | 0.19 | 0.23 | 23.04 | 20.71 | 25.42 |
| event | TRUE - FALSE | 6.00 | South | 0.21 | 0.01 | 18.44 | 0.00 | 249.68 | 0.19 | 0.23 | 23.27 | 20.56 | 26.05 |
| event | TRUE - FALSE | 7.00 | South | 0.21 | 0.01 | 16.13 | 0.00 | 192.07 | 0.19 | 0.24 | 23.50 | 20.37 | 26.71 |
| event | TRUE - FALSE | 8.00 | South | 0.21 | 0.01 | 14.28 | 0.00 | 151.27 | 0.18 | 0.24 | 23.73 | 20.17 | 27.40 |
| event | TRUE - FALSE | 9.00 | South | 0.21 | 0.02 | 12.79 | 0.00 | 121.94 | 0.18 | 0.25 | 23.96 | 19.94 | 28.11 |
| event | TRUE - FALSE | 10.00 | South | 0.22 | 0.02 | 11.57 | 0.00 | 100.38 | 0.18 | 0.25 | 24.19 | 19.71 | 28.83 |
This version estimates the post-release contrast at each Flood Factor score and FEMA SFHA status. This is the continuous-score robustness check that most directly parallels the main SFHA-moderation story.
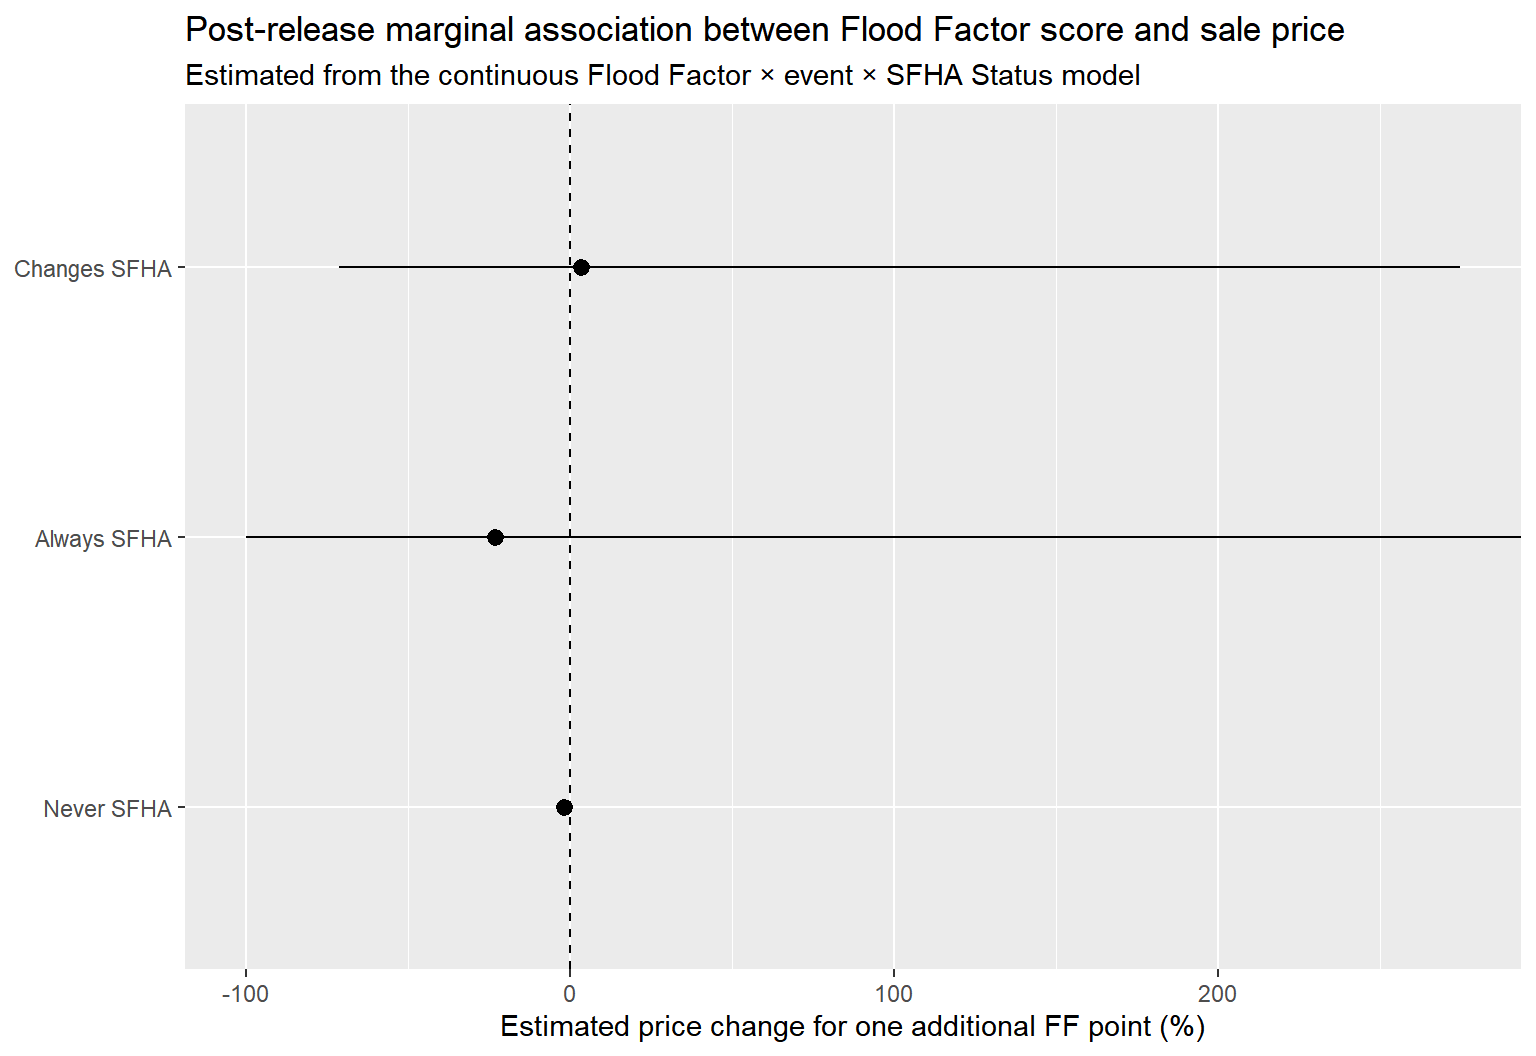
| term | contrast | event | change_type | estimate | std.error | statistic | p.value | s.value | conf.low | conf.high | pct_change | pct_low | pct_high |
|---|---|---|---|---|---|---|---|---|---|---|---|---|---|
| env_flood_fs_factor | dY/dX | TRUE | Never SFHA | -0.02 | 0.00 | -9.34 | 0.00 | 66.55 | -0.02 | -0.01 | -1.84 | -2.23 | -1.46 |
| env_flood_fs_factor | dY/dX | TRUE | Always SFHA | -0.26 | 6695.76 | -0.00 | 1.00 | 0.00 | -13123.70 | 13123.18 | -23.16 | -100.00 | |
| env_flood_fs_factor | dY/dX | TRUE | Changes SFHA | 0.03 | 0.66 | 0.05 | 0.96 | 0.06 | -1.25 | 1.32 | 3.56 | -71.39 | 274.86 |
This model is highly saturated and is best treated as appendix or diagnostic material. It estimates whether the post-release slope of Flood Factor score differs jointly by FEMA SFHA status and region.
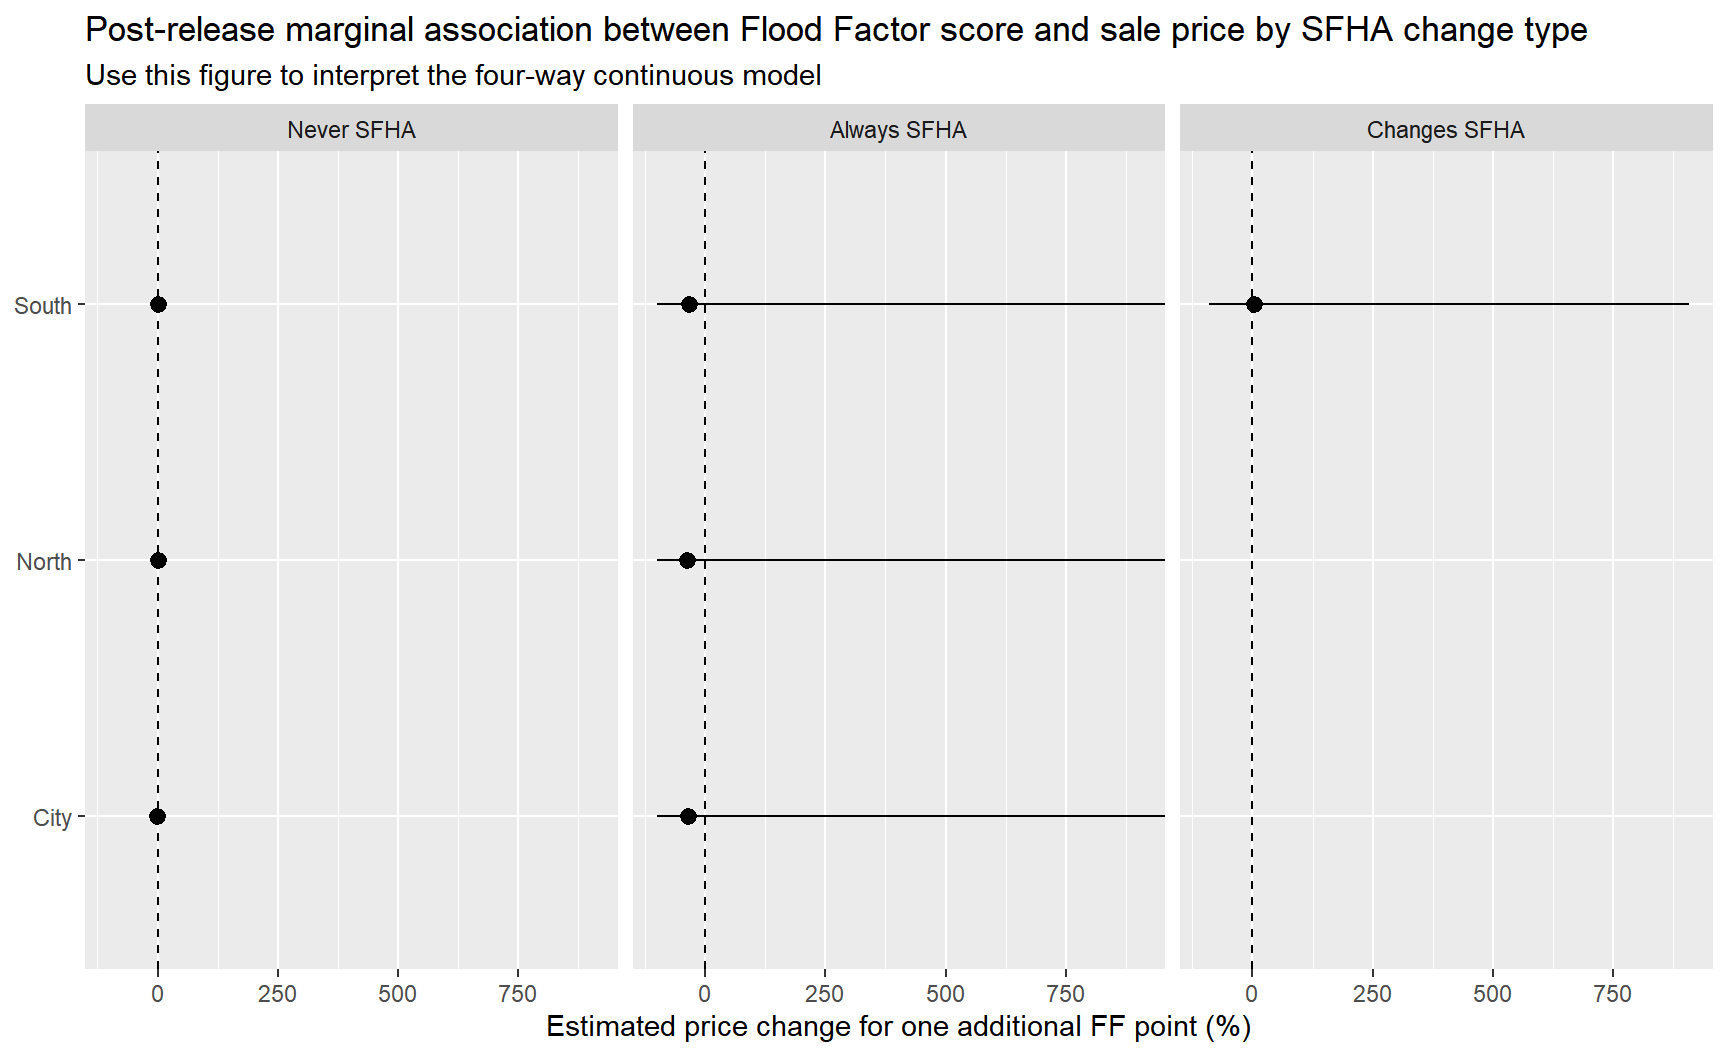
| change_type | Triad | estimate | std.error | conf.low | conf.high | pct_change | pct_low | pct_high | p.value |
|---|---|---|---|---|---|---|---|---|---|
| Never SFHA | City | -0.02 | 0.00 | -0.03 | -0.02 | -2.18 | -2.66 | -1.70 | 0.00 |
| Never SFHA | North | -0.00 | 0.00 | -0.01 | 0.00 | -0.08 | -0.58 | 0.43 | 0.76 |
| Never SFHA | South | 0.00 | 0.00 | -0.00 | 0.01 | 0.18 | -0.28 | 0.65 | 0.45 |
| Always SFHA | City | -0.43 | 8411.74 | -16487.15 | 16486.28 | -35.21 | -100.00 | 1.00 | |
| Always SFHA | North | -0.46 | 8411.59 | -16486.87 | 16485.95 | -36.81 | -100.00 | 1.00 | |
| Always SFHA | South | -0.39 | 10585.78 | -20748.14 | 20747.35 | -32.60 | -100.00 | 1.00 | |
| Changes SFHA | South | 0.03 | 1.16 | -2.24 | 2.31 | 3.53 | -89.36 | 906.93 | 0.98 |
The following table identifies coefficients omitted from interpretation due to extremely large standard errors or lack of identification under the fixed-effects structure. Large standard errors typically indicate that a coefficient is not identified within the property fixed-effects framework because the underlying variable does not vary within parcels over time, or because certain interaction combinations contain extremely sparse observations.