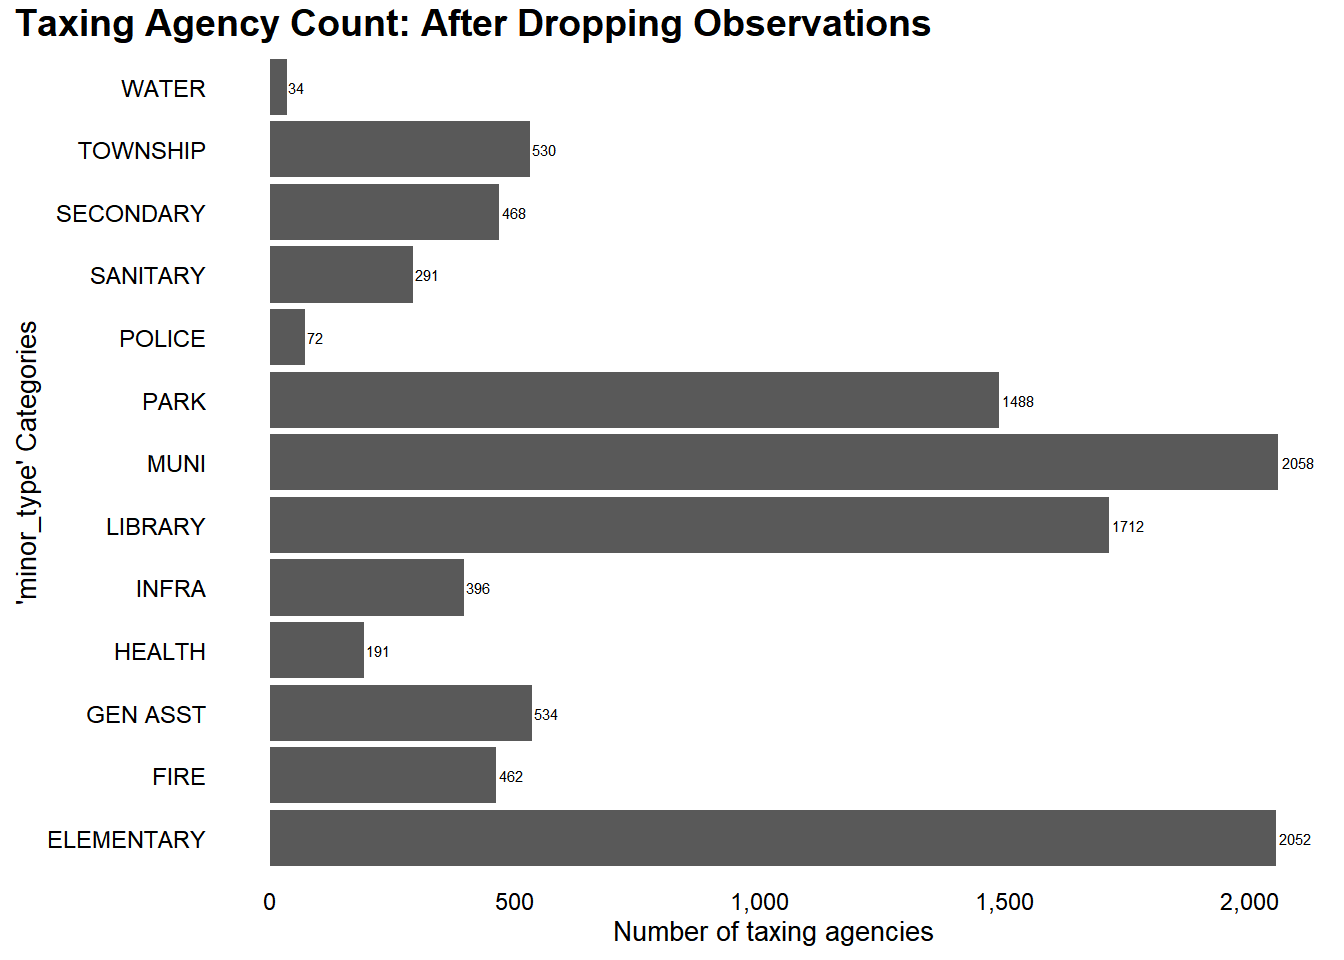
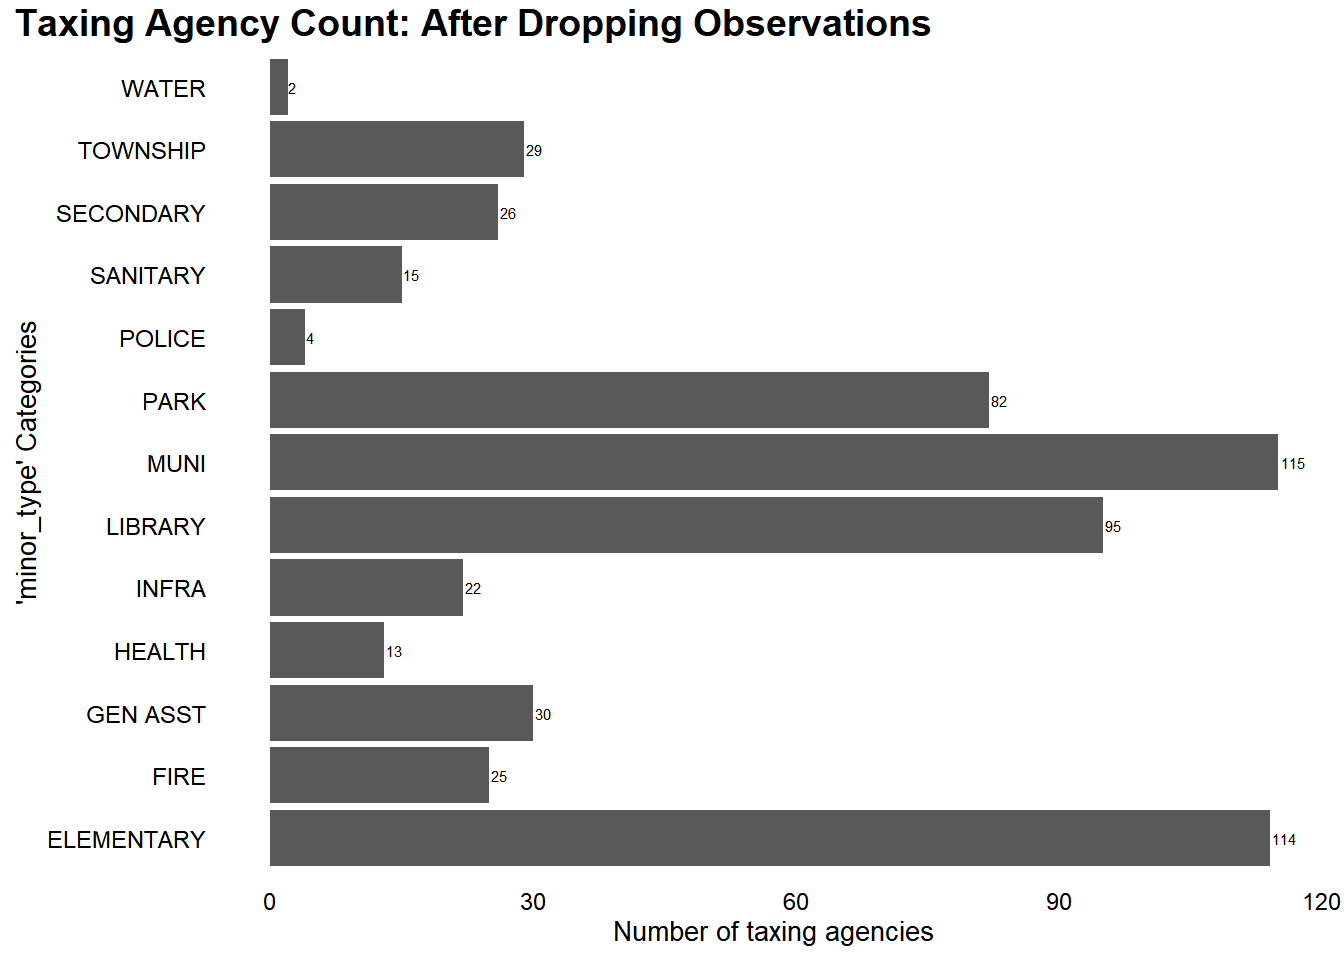
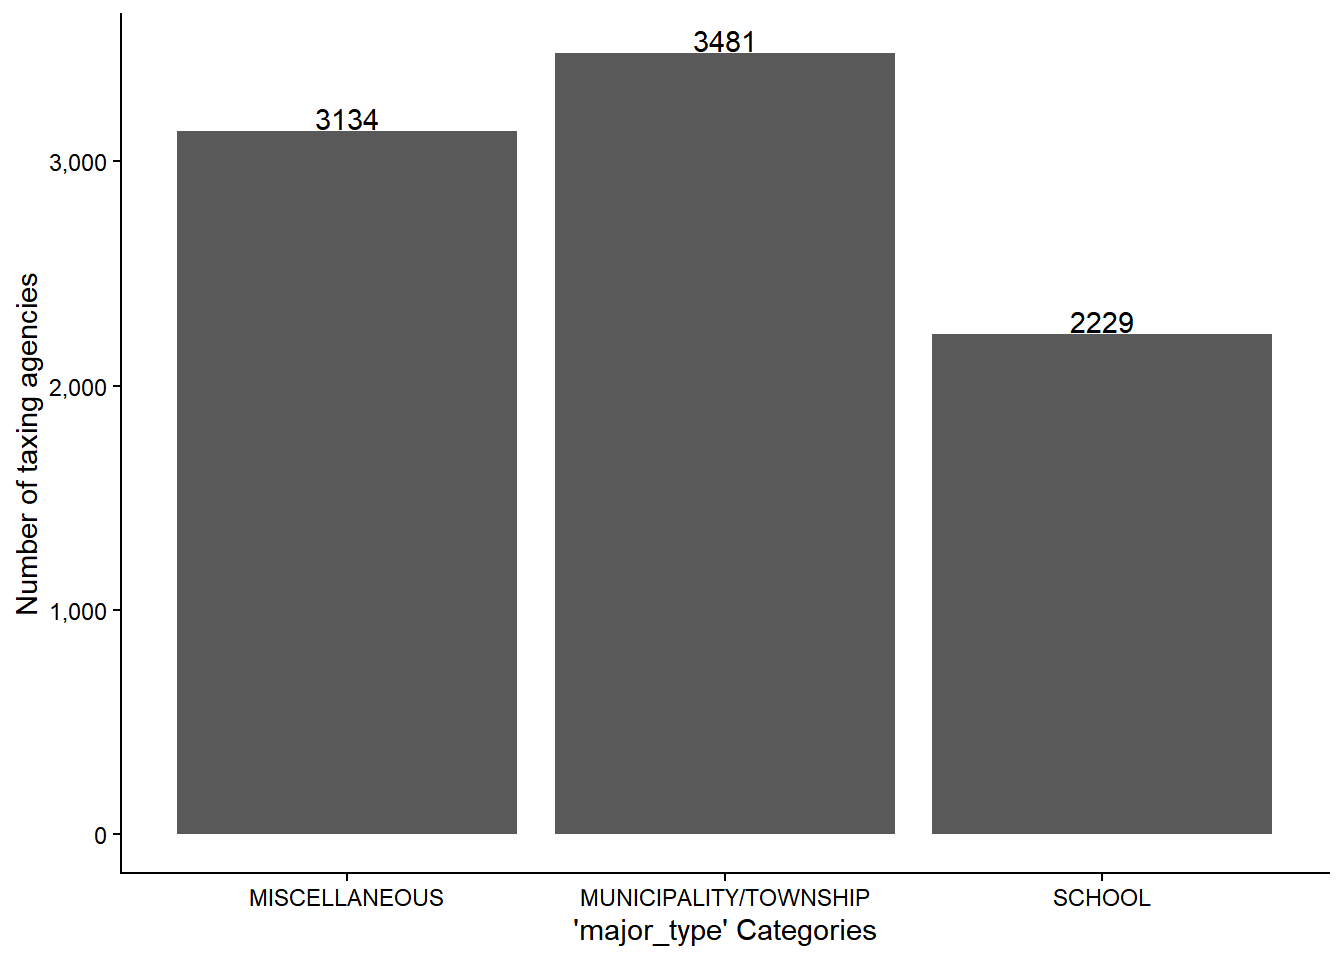
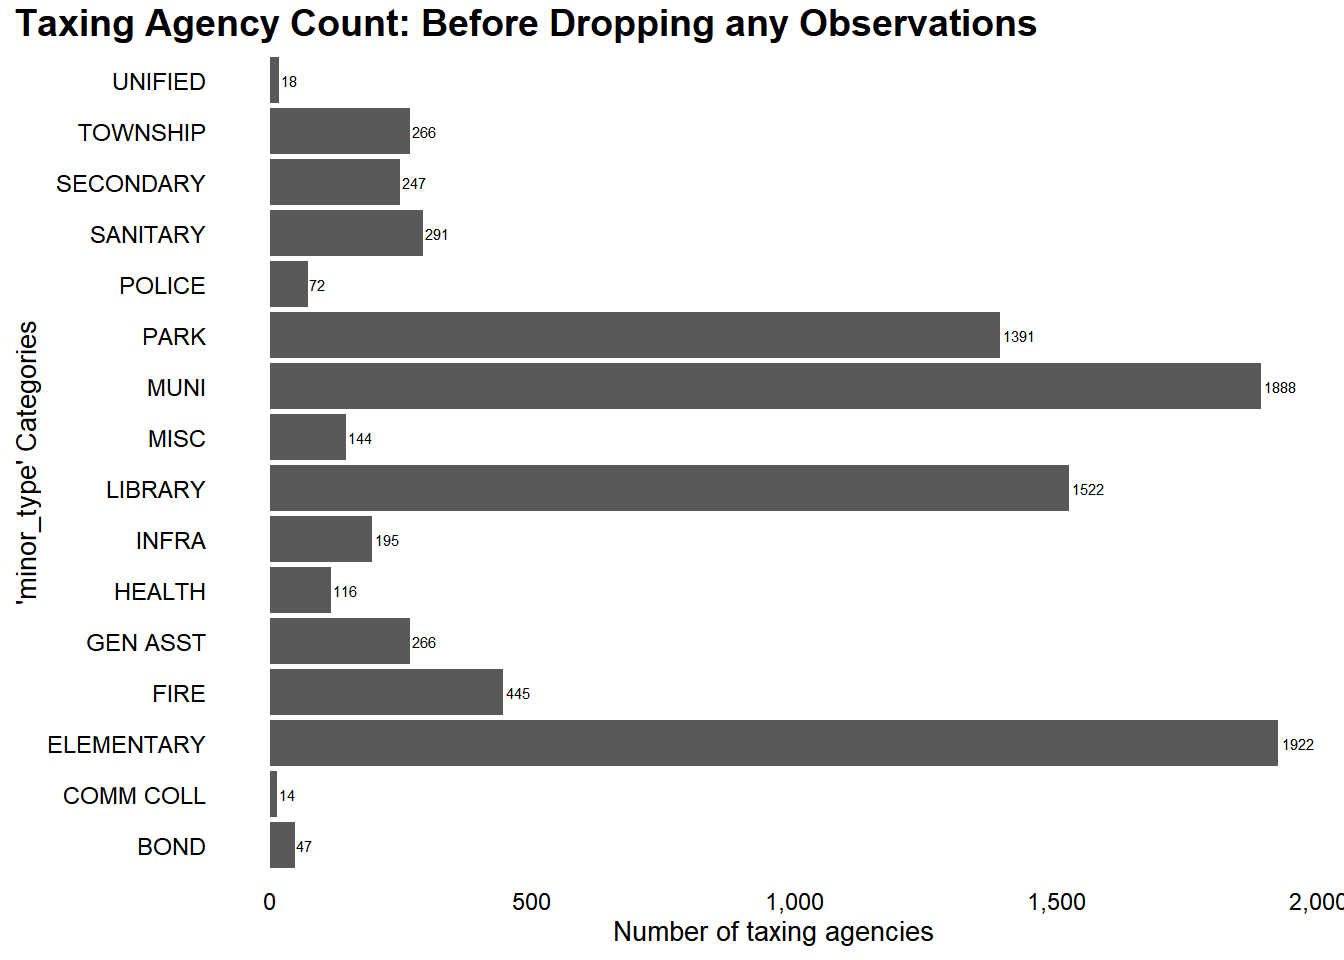
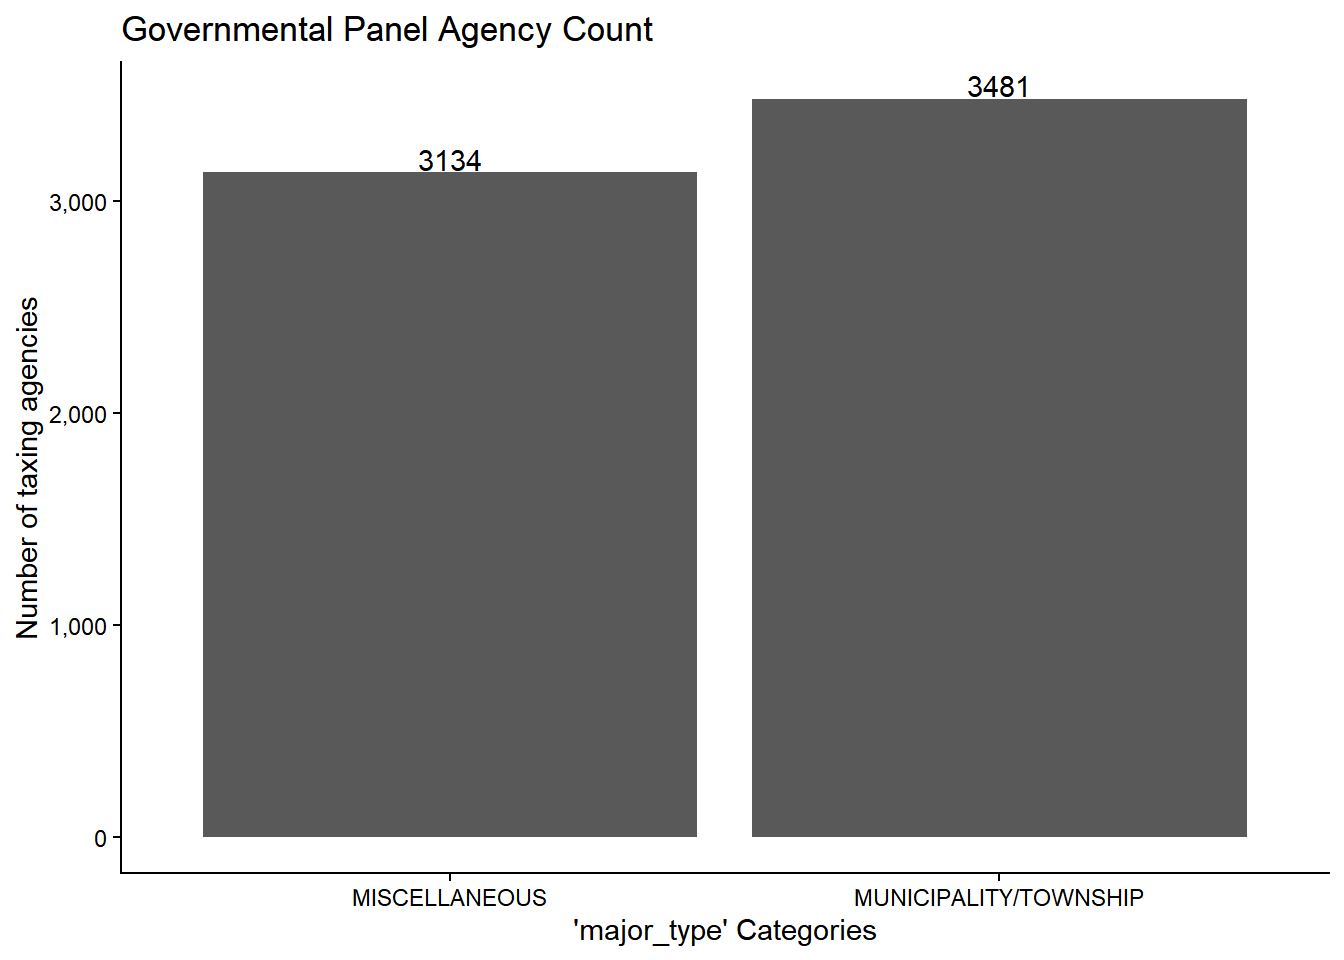
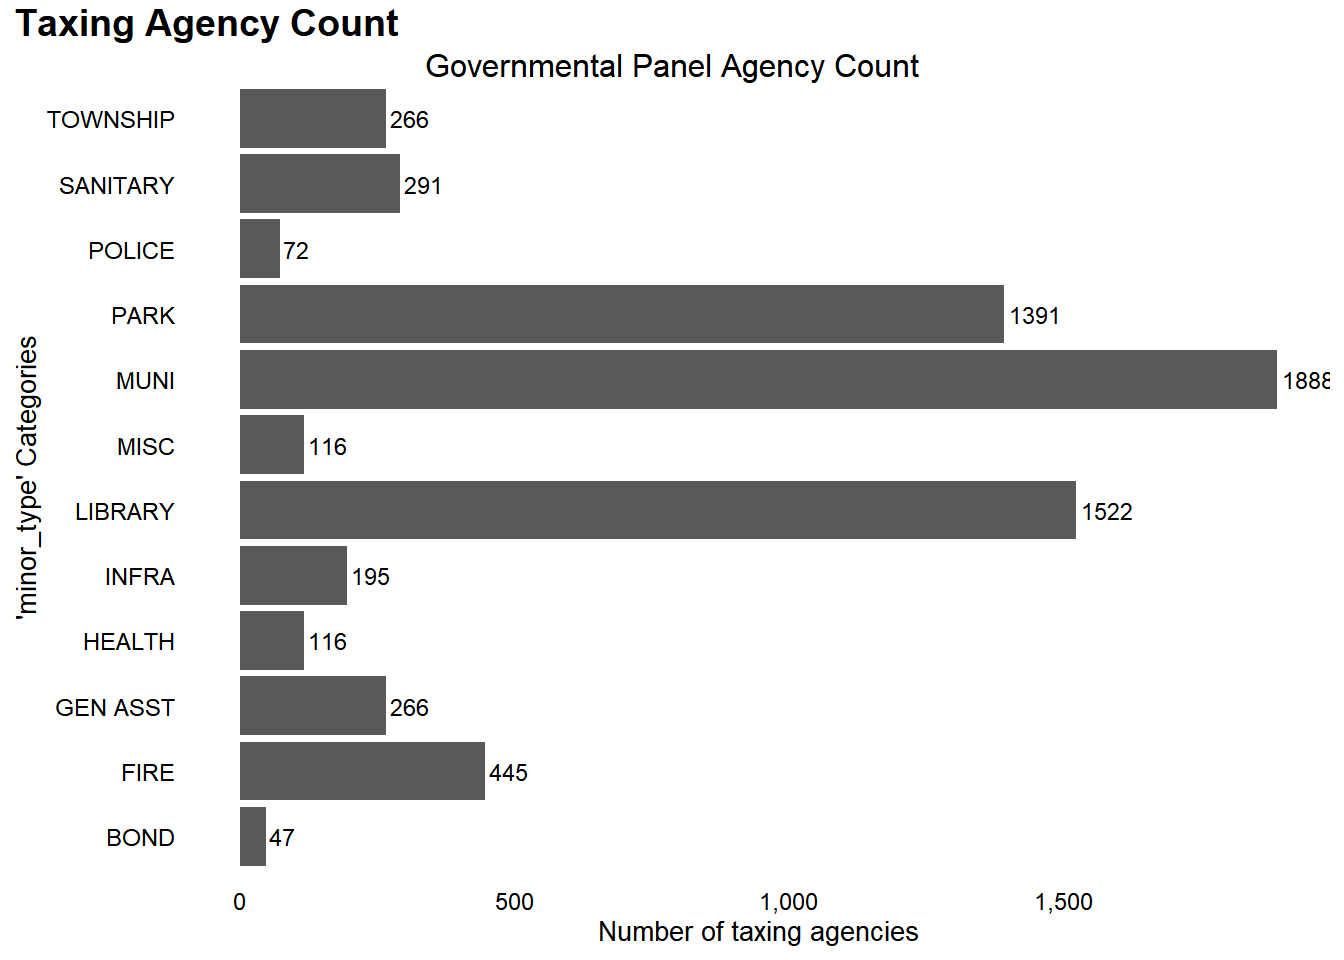
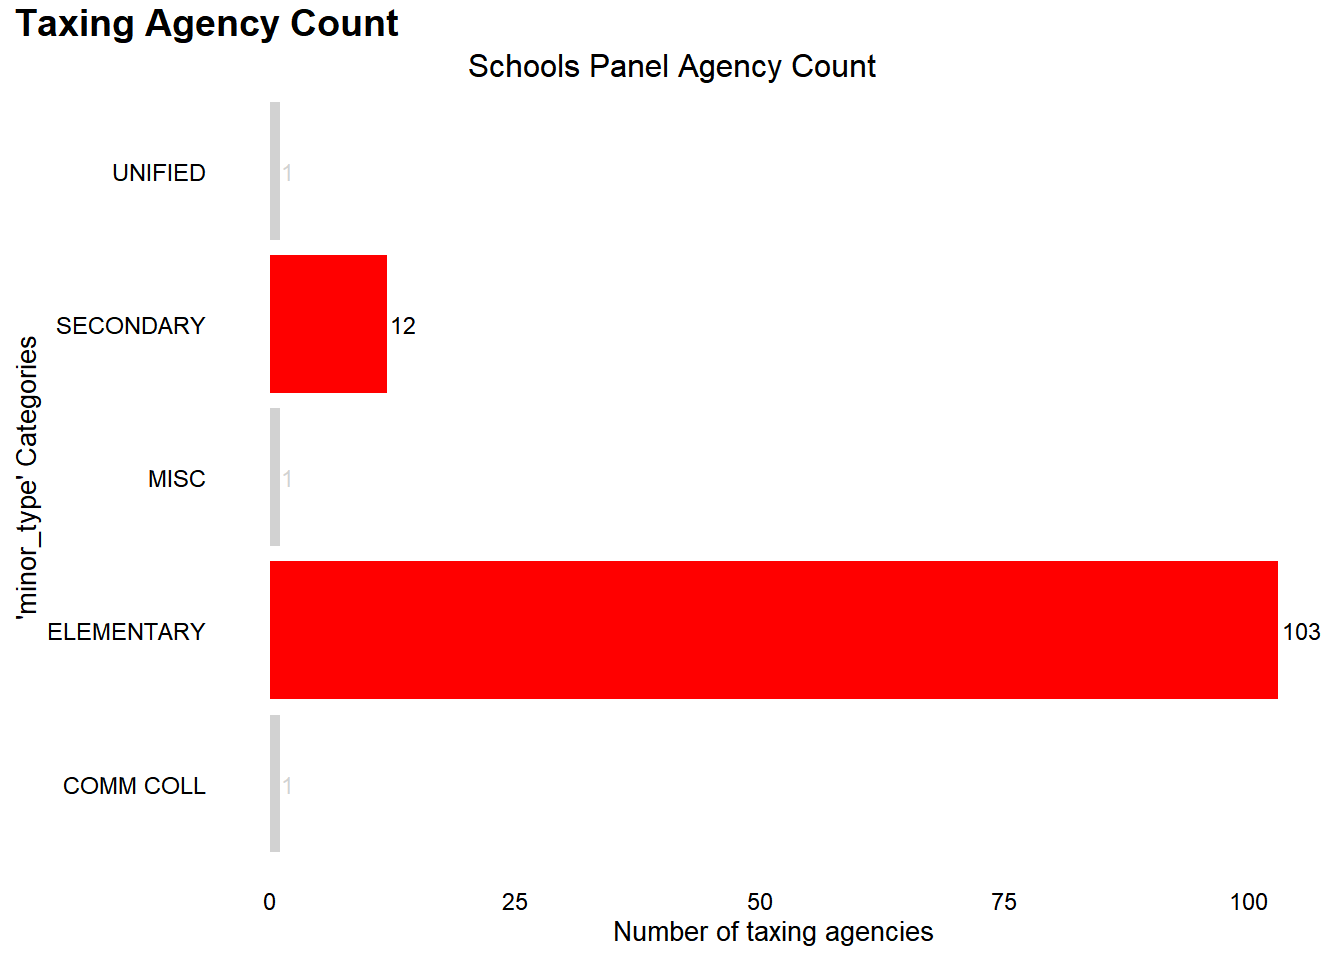
--- title: "Descriptive Graphs" author: "AMW & MVH" format: html editor: visual --- ## Bring in the data ```{r warning = FALSE, message=FALSE} library(tidyverse) library(dplyr) library(plm) #install.packages("gghighlight") library(gghighlight) #16,354 obs raw_data_joined <- read_csv("agency_raw_joined.csv") panel_data <- read_csv("panel_data.csv") # Tables from PTAXSIM cpi <- read_csv("./Necessary_Files/cpi.csv") # has two year variables!! eq_factor <- read_csv("./Necessary_Files/eq_factor.csv") %>% select(-eq_factor_tentative) ``` ```{r} #| output: false <- function (){ theme_minimal () %+replace% #replace elements we want to change theme (#grid elements panel.grid.major = element_blank (), #strip major gridlines panel.grid.minor = element_blank (), #strip minor gridlines axis.ticks = element_blank (), #strip axis ticks #since theme_minimal() already strips axis lines, #we don't need to do that again #text elements plot.title = element_text ( #title size = 14 , #set font size face = 'bold' , #bold typeface hjust = 0 , #left align vjust = 2 ), #raise slightly plot.title.position = "plot" ,plot.subtitle = element_text ( #subtitle size = 12 ), #font size plot.caption = element_text ( #caption size = 9 , #font size hjust = 1 ), #right align axis.title = element_text ( #axis titles size = 10 ), #font size axis.text = element_text ( #axis text size = 9 ), #font size axis.text.x = element_text ( #margin for axis text margin= margin (5 , b = 10 ))#since the legend often requires manual tweaking #based on plot content, don't define it here <- panel_data |> filter (! minor_type %in% c ("BOND" , "UNIFIED" , "COMM COLL" , "COOK" , "MISC" , "MOSQUITO" ) ) ``` ```{r} %>% ggplot (aes (x= major_type)) + geom_bar () + theme_classic () + geom_text (aes (label = ..count..), stat = "count" , vjust= - .1 ) + # coord_flip() + labs (y= "Number of taxing agencies" , x= "'major_type' Categories" ) + scale_y_continuous (label = scales:: comma)%>% ggplot (aes (x= minor_type)) + geom_bar () + theme_awm ( ) + geom_text (aes (label = ..count..), stat = "count" , hjust= - .1 , size = 2 ) + coord_flip () + labs (title = "Taxing Agency Count: Before Dropping any Observations" , y= "Number of taxing agencies" , x= "'minor_type' Categories" ) + scale_y_continuous (label = scales:: comma)%>% filter (year == 2022 ) %>% ggplot (aes (x= minor_type)) + geom_bar () + theme_awm ( ) + geom_text (aes (label = ..count..), stat = "count" , hjust= - .1 , size = 2 ) + coord_flip () + labs (title = "Taxing Agency Count: Before Dropping any Observations" , y= "Number of taxing agencies" , x= "'minor_type' Categories" ) + scale_y_continuous (label = scales:: comma)%>% ggplot (aes (x= major_type)) + geom_bar () + theme_classic () + geom_text (aes (label = ..count..), stat = "count" , vjust= - .1 ) + # coord_flip() + labs (y= "Number of taxing agencies" , x= "'major_type' Categories" ) + scale_y_continuous (label = scales:: comma)%>% ggplot (aes (x= minor_type)) + geom_bar () + theme_awm ( ) + geom_text (aes (label = ..count..), stat = "count" , hjust= - .1 , size = 2 ) + coord_flip () + labs (title = "Taxing Agency Count: After Dropping Observations" , y= "Number of taxing agencies" , x= "'minor_type' Categories" ) + scale_y_continuous (label = scales:: comma)%>% filter (year == 2022 ) %>% ggplot (aes (x= minor_type)) + geom_bar () + theme_awm ( ) + geom_text (aes (label = ..count..), stat = "count" , hjust= - .1 , size = 2 ) + coord_flip () + labs (title = "Taxing Agency Count: After Dropping Observations" , y= "Number of taxing agencies" , x= "'minor_type' Categories" ) + scale_y_continuous (label = scales:: comma)``` ## Recoding Variables ```{r} <- c ("030250000" , "030270000" , "030300000" , "030585000" , "030840000" , "030890000" , "031150000" )<- c ("030770000" , "030800000" ,"030880000" , "031070000" , "031190000" , "031250000" )<- raw_data_joined %>% left_join (cpi, by = c ("year" = "levy_year" )) %>% left_join (eq_factor) %>% mutate (# year = as.factor(year) agency_num = as.character (agency_num),agency_num = str_pad (agency_num, 9 , "left" , "0" ), #add missing leading zeros first6 = str_pad (first6, 6 , "left" , "0" ),home_rule_ind = as.character (home_rule_ind), #change reference category minor_type = as.factor (minor_type),reassess_year = as.character (reassess_year)) %>% mutate (cty_total_eav = as.numeric (cty_total_eav), # taxable eav in cook and neighboring counties cty_cook_eav = as.numeric (cty_cook_eav), # taxable EAV in cook county only pct_in_Cook = cty_cook_eav / cty_total_eav, # to identify taxing agencies that cross county lines total_final_levy = as.numeric (total_final_levy), total_reduced_levy = as.numeric (total_reduced_levy), # for non-HR agencies that have their levy reduced av = cty_cook_eav / eq_factor_final,first6_w_hr = str_c (first6, "_" , home_rule_ind),agency_w_hr = str_c (agency_num, "_" , home_rule_ind)%>% group_by (year, cty_total_eav, home_rule_ind) %>% mutate (summed_levy_sharetaxbase = sum (total_final_levy)+ 1 ) %>% # grouped by tax base and year ungroup () %>% group_by (year, first6, home_rule_ind) %>% mutate (summed_levy_first6 = sum (total_final_levy)+ 1 ) %>% # grouped by first 6 digits in agency number ungroup ()<- recoded_data %>% filter (pct_in_Cook > 0.9 ) %>% #keep only agencies greater than 90% in Cook mutate (total_final_levy_4log = total_final_levy + 1 ,#Add 1 to total_final_levy to allow ln transformation. log_eav = log (cty_total_eav), # eav within Cook AND neighboring counties. log_levy = log (total_final_levy_4log),log_av = log (av),year = as.factor (year), # for plm() agency_num = as.factor (agency_num) # for plm() %>% filter (minor_type != "SSA" ) # drops 5332 taxing agencies (agency-year combos) ## 7921 observations remain after removing SSAs ## ``` ```{r} %>% ggplot (aes (x= major_type)) + geom_bar () + theme_classic () + geom_text (aes (label = ..count..), stat = "count" , vjust= - .1 ) + # coord_flip() + labs (y= "Number of taxing agencies" , x= "'major_type' Categories" )+ scale_y_continuous (label = scales:: comma)%>% ggplot (aes (x= minor_type)) + geom_bar () + theme_awm ( ) + geom_text (aes (label = ..count..), stat = "count" , hjust= - .1 , size = 2 ) + coord_flip () + labs (title = "Taxing Agency Count: Before Dropping any Observations" , y= "Number of taxing agencies" , x= "'minor_type' Categories" )+ scale_y_continuous (label = scales:: comma)``` ```{r} # turn it into panel data! # two way fixed effects will be used for agency and year. <- pdata.frame (recoded_data, index = c ("agency_num" , "year" ))# need to detach dplyr because conflict w/ plm lag command detach ("package:dplyr" , unload = TRUE )$ lag_totallevy <- plm:: lag (panel_data$ total_final_levy, 1 )$ lag_cty_total_eav <- plm:: lag (panel_data$ cty_total_eav, 1 )$ lag_av <- plm:: lag (panel_data$ av, 1 )$ eav_lag1 <- plm:: lag (panel_data$ cty_total_eav, 1 )$ eav_lag2 <- plm:: lag (panel_data$ cty_total_eav, 2 )$ eav_lag3 <- plm:: lag (panel_data$ cty_total_eav, 3 )$ eav_lag4 <- plm:: lag (panel_data$ cty_total_eav, 4 )$ reassess_lag1 <- plm:: lag (panel_data$ reassess_year, 1 )$ reassess_lag2 <- plm:: lag (panel_data$ reassess_year, 2 )#boss said leave redundant code. library (dplyr)<- panel_data %>% mutate (eav_pct_change = (cty_total_eav - lag_cty_total_eav)/ lag_cty_total_eav,tfl_pct_change = (total_final_levy - lag_totallevy) / lag_totallevy,av_pct_change = (av - lag_av) / lag_av,up_down = ifelse (eav_pct_change > 0 , "increased" , "decreased" )) %>% mutate (# eav_pct_change = ifelse(is.na(eav_pct_change), 0, eav_pct_change), home_rule_ind = as.factor (home_rule_ind),minor_type = as.factor (minor_type),major_type = as.factor (major_type),first6 = as.factor (first6))detach ("package:dplyr" , unload = TRUE )$ lag_eav_pct_change1 <- plm:: lag (panel_data$ eav_pct_change, 1 )$ lag_eav_pct_change2 <- plm:: lag (panel_data$ eav_pct_change, 2 )$ lag_av_pct_change1 <- plm:: lag (panel_data$ av_pct_change, 1 )$ lag_av_pct_change2 <- plm:: lag (panel_data$ av_pct_change, 2 )library (dplyr)<- panel_data %>% filter (major_type == "SCHOOL" ) %>% mutate (lag_totallevy = as.numeric (lag_totallevy))<- panel_data %>% mutate (lag_totallevy = as.numeric (lag_totallevy)) %>% filter ( major_type != "COOK COUNTY" & major_type != "SCHOOL" ) #revised 11/26 to filter "COOK COUNTY" table (governments_panel$ minor_type)<- as.data.frame (governments_panel)<- as.data.frame (schools_panel)<- as.data.frame (panel_data)``` ```{r} #install.packages("ggThemeAssist") library (ggThemeAssist)%>% ggplot (aes (x= major_type)) + geom_bar () + theme_classic () + geom_text (aes (label = ..count..), stat = "count" , vjust= - .1 ) + # coord_flip() + labs (title = "Governmental Panel Agency Count" , y= "Number of taxing agencies" , x= "'major_type' Categories" )+ scale_y_continuous (label = scales:: comma)%>% ggplot (aes (x= minor_type)) + geom_bar ()+ geom_text (aes (label = ..count..), stat = "count" , hjust= - .1 , size = 3 + coord_flip () + labs (title = "Taxing Agency Count" , subtitle = "Governmental Panel Agency Count" , y= "Number of taxing agencies" , x= "'minor_type' Categories" )+ scale_y_continuous (label = scales:: comma) + theme (axis.ticks = element_line (linetype = "blank" ),panel.background = element_rect (fill = NA )) + theme_awm ( ) %>% filter (year == 2022 ) %>% ggplot (aes (x= minor_type)) + geom_bar (fill = "red" )+ geom_text (aes (label = ..count..), stat = "count" , hjust= - .1 , size = 3 ) + coord_flip () + labs (title = "Taxing Agency Count" , subtitle = "Schools Panel Agency Count" , y= "Number of taxing agencies" , x= "'minor_type' Categories" )+ scale_y_continuous (label = scales:: comma) + gghighlight (minor_type %in% c ("SECONDARY" , "ELEMENTARY" )) + theme_awm ( ) ```