suppressPackageStartupMessages({library(tidyverse)library(haven)library(fixest)library(modelsummary)library(broom)library(glue)library(readr)library(gt)})options(scipen =999)table_dir <- fs::path("paper", "tables")missing_output <-function(path) {cat(paste0("<p><strong>Missing saved output:</strong> <code>", htmltools::htmlEscape(as.character(path)),"</code></p>","<p>Render with <code>-P run_models:true</code> to create it.</p>" ) )}display_model_table <-function(file_stub, title =NULL, notes =NULL, coef_map =NULL,gof_omit ="IC|Log|Adj|RMSE|Std.Errors", gof_function =NULL, add_rows =NULL) { model_path <- fs::path(table_dir, paste0(file_stub, "_models.rds"))if (!fs::file_exists(model_path)) {missing_output(model_path)return(invisible(NULL)) } models <-readRDS(model_path)modelsummary( models,title = title,notes = notes,coef_map = coef_map,stars =c("*"= .10, "**"= .05, "***"= .01),gof_omit = gof_omit,add_rows = add_rows )}display_df_table <-function(file_stub, title =NULL, digits =3) { rds_path <- fs::path(table_dir, paste0(file_stub, ".rds"))if (!fs::file_exists(rds_path)) {missing_output(rds_path)return(invisible(NULL)) }readRDS(rds_path) |> knitr::kable(format ="html",caption = title,digits = digits,escape =TRUE )}# ================================================================# 4. HELPERS# ================================================================vcov_uid <-~n_uniqueidtidy_plus <-function(model, extra =NULL) { out <- broom::tidy(model)if (!is.null(extra)) {attr(out, "extra") <- extra } out}safe_wald_p <-function(model, hypothesis) { out <-tryCatch(fixest::wald(model, hypothesis), error =function(e) NULL)if (is.null(out)) return(NA_real_) out$p}safe_lincom <-function(model, combo) { out <-tryCatch(fixest::lincom(model, combo), error =function(e) NULL)if (is.null(out)) {return(tibble(estimate =NA_real_, ci_low =NA_real_, ci_high =NA_real_, p.value =NA_real_)) }tibble(estimate = out$estimate,ci_low = out$ci_low,ci_high = out$ci_high,p.value = out$p.value )}# ---- output folder ---------------------------------------------------------# These HTML outputs are intentionally written to a stable, Quarto-friendly# path for the replication site.output_dir <-file.path("paper", "tables")dir.create(output_dir, recursive =TRUE, showWarnings =FALSE)save_table <-function(models, file_stub, title =NULL, notes =NULL,coef_map =NULL, gof_omit ="IC|Log|Adj|RMSE|Std.Errors",gof_function =NULL,add_rows =NULL) { out_html <-file.path(output_dir, paste0(file_stub, ".html")) out_rds <-file.path(output_dir, paste0(file_stub, "_models.rds"))modelsummary( models,output = out_html,title = title,notes = notes,coef_map = coef_map,stars =c("*"= .10, "**"= .05, "***"= .01),gof_omit = gof_omit )saveRDS(models, out_rds)invisible(models)}html_escape <-function(x) { x <-as.character(x) x <-gsub("&", "&", x, fixed =TRUE) x <-gsub("<", "<", x, fixed =TRUE) x <-gsub(">", ">", x, fixed =TRUE) x}save_df_table <-function(df, file_stub, title =NULL, digits =3) { out_html <-file.path(output_dir, paste0(file_stub, ".html")) out_rds <-file.path(output_dir, paste0(file_stub, ".rds")) df_out <- df |>mutate(across(where(is.numeric), ~round(.x, digits))) html <- knitr::kable(df_out, format ="html", caption = title, escape =TRUE)writeLines(html, out_html)saveRDS(df_out, out_rds)invisible(df_out)}safe_se <-function(model, term) { out <-tryCatch(fixest::se(model)[[term]], error =function(e) NA_real_)if (is.null(out)) NA_real_else out}safe_coef <-function(model, term) { out <-tryCatch(stats::coef(model)[[term]], error =function(e) NA_real_)if (is.null(out)) NA_real_else out}model_n <-function(model) { out <-tryCatch(fixest::nobs(model), error =function(e) NULL)if (is.null(out)) out <-tryCatch(stats::nobs(model), error =function(e) NULL)if (is.null(out)) out <-tryCatch(model$nobs, error =function(e) NULL)if (is.null(out) ||length(out) ==0||is.na(out[1])) return(NA_integer_)as.integer(out[1])}term_stats <-function(model, term ="d_eav", label =NULL) { est <-safe_coef(model, term) se <-safe_se(model, term)tibble(model = label %||%deparse(substitute(model)),N =model_n(model),estimate = est,std_error = se,upper_bound = est +1.645* se,p_value =tryCatch(2*pnorm(abs(est / se), lower.tail =FALSE), error =function(e) NA_real_) )}p_equal_terms <-function(model, lhs ="neg_d_eav", rhs ="pos_d_eav") {tryCatch(fixest::wald(model, paste0(lhs, " = ", rhs))$p, error =function(e) NA_real_)}lincom_sum <-function(model, terms, label =NULL) { b <- stats::coef(model) V <-tryCatch(stats::vcov(model), error =function(e) NULL)if (is.null(V) ||!all(terms %in%names(b)) ||!all(terms %in%rownames(V))) {return(tibble(model = label %||%deparse(substitute(model)),N =model_n(model),lagged_magnitude =NA_real_,std_error =NA_real_,A_upper_bound =NA_real_,lagged_p =NA_real_ )) } est <-sum(b[terms]) Vsub <- V[terms, terms, drop =FALSE] se <-sqrt(sum(Vsub))tibble(model = label %||%deparse(substitute(model)),N =model_n(model),lagged_magnitude = est,std_error = se,A_upper_bound = est +1.645* se,lagged_p =2*pnorm(abs(est / se), lower.tail =FALSE) )}sample_index <-function(model, data) { idx <-tryCatch(fixest::obs(model), error =function(e) NULL)if (!is.null(idx)) return(idx)# fallback: mark complete cases for variables used in the model is not perfect,# but prevents hard failure if fixest::obs changes.seq_len(nrow(data))}safe_first_stage_f <-function(model) {# fixest exposes several IV fit statistics, but names differ across versions. out <-tryCatch(fixest::fitstat(model, "ivf1"), error =function(e) NULL)if (is.null(out)) return(NA_real_)as.numeric(unlist(out))[1]}`%||%`<-function(x, y) if (is.null(x)) y else xagency_label <-function(x) {recode(as.character(x),HR_muni ="Home-rule municipalities",NonHR_muni ="Non-home-rule municipalities",Muni ="All Munis",Other ="Other",Township ="Townships",School ="Schools",.default =as.character(x) )}
Data preparation and shared helpers
This setup chunk reads the raw files, constructs the variables, defines the model helpers, and creates the results/tables/ folder. It is visible for transparency but folded by default.
Code
# Setup ----------------------------------------------------------------------# descriptive_stats_15_lags_cluster.R# Rough R translation of: descriptive stats_15_lags_cluster.do# Converted from Stata to R on 2026-03-06.# Updated on May 11th 2026 using 22_lags_cluster.do## Notes:# - Stata's esttab output is translated to modelsummary output. You can# - Some table formatting is approximate rather than identical.
Code
# ================================================================# 1. READ + MERGE DATA# ================================================================message(Sys.Date())message(format(Sys.time(), "%H:%M:%S"))# file DM used: #"NTA_data_2024_10_14.csv"# email shows that he had questions about this file and then michael sent one for 10_16main_df <-read_csv("NTA_data_2024_10_14.csv")# main_df |> distinct(agency_group)#415 distinct agency_groups in the 10_14 file.# File MVH sent him:# main_df <- read_csv("NTA_data_2024_10_16.csv") |># arrange(type)# Most recent file AWM had on her computer:# main_df <- read_csv("NTA_data_2024_11_08.csv") |># arrange(type)agency_lookup <-read_dta("fips_all_agency_name.dta")# anti_join(main_df, agency_lookup)main_df <- main_df |>left_join(agency_lookup, by ="agency_group")# 7470 observations before dropping NAs# 7416 after dropping NAs# Stata listed unmatched rows and dropped merge==1 rows.# In dplyr terms: drop observations from master that did not match.main_df <- main_df |>filter(!is.na(fipsid))census_df <-read_dta("census_data.dta")# 3,509 observations didn't have the census data and get dropped unless missing data is filled in between census years.#anti_join(main_df, census_df)main_df <- main_df |>left_join(census_df, by =c("fipsid", "year"))# ================================================================# 2. MERGE EQUALIZATION FACTORS + CLEAN NUMERIC FIELDS# ================================================================# Stata used a .dta called eq_factor after previously creating it from CSV.# Adjust extension if your stored file is actually .csv.eq_factor_path_dta <-file.path("eq_factor.dta")eq_factor_path_csv <-file.path("Necessary_Files/eq_factor.csv")eq_factor <-if (file.exists(eq_factor_path_dta)) {read_dta(eq_factor_path_dta)} elseif (file.exists(eq_factor_path_csv)) {read_csv(eq_factor_path_csv, show_col_types =FALSE)} else {stop("Could not find eq_factor.dta or eq_factor.csv in post nta folder.")}main_df <- main_df |>left_join(eq_factor, by ="year")string_num_vars <-c("assess_year_eav", "assess_year_av", "av_true", "rate_smooth", "total_final_levy")main_df <- main_df |>mutate(across(any_of(string_num_vars),~ readr::parse_number(as.character(.x), na =c("NA", "", ".")),.names ="n_{.col}" ) )# ================================================================# 3. PANEL SETUP + CONSTRUCTED VARIABLES# ================================================================main_df <- main_df |>mutate(n_agency_group =as.integer(factor(agency_group)),n_uniqueid =as.integer(factor(uniqueid)) ) |>arrange(n_agency_group, year) |>filter(!is.na(n_agency_group)) |>group_by(n_agency_group) |>arrange(year, .by_group =TRUE) |>mutate(lag_av =lag(av, 1),lag2_av =lag(av, 2),lag3_av =lag(av, 3),lead1_av =lead(av, 1),lead2_av =lead(av, 2),lead3_av =lead(av, 3),lag_eq_factor_final =lag(eq_factor_final, 1),lag2_eq_factor_final =lag(eq_factor_final, 2),lag3_eq_factor_final =lag(eq_factor_final, 3),lag_reassess_year =lag(reassess_year, 1),lag2_reassess_year =lag(reassess_year, 2) ) |>ungroup() |>filter(year >=2008)main_df <- main_df |>mutate(t =case_when( reassess_year ==1~1, lag_reassess_year ==1~2, lag2_reassess_year ==1~3, ),r =case_when( t ==1~ ((lead3_av / av)^(1/3)) -1, t ==2~ ((lead2_av / lag_av)^(1/3)) -1, t ==3~ ((lead1_av / lag2_av)^(1/3)) -1,TRUE~0 ),EstV =case_when( t ==1~ av, t ==2~ lag_av * (1+ r), t ==3~ lag2_av * (1+ r)^2,TRUE~0 ),ln_EstV =log(EstV),d_av =100*log(av / lag_av)) |>group_by(n_agency_group) |>mutate(d_eav =100*log((av * eq_factor_final) / (lag_av *lag(eq_factor_final))),d_levy =100*log(total_final_levy /lag(total_final_levy)),d_total_ig_revenue =100*log(total_ig_revenue /lag(total_ig_revenue)),d_enrollment =100*log(enrollment /lag(enrollment)),has_ig_data =if_else(is.na(d_total_ig_revenue), 0, 1),type_2 =case_when( type =="Muni"& home_rule_ind ==1~"HR_muni",## Added this row below!! type =="Muni"& home_rule_ind ==0~"NonHR_muni",TRUE~as.character(type) ) ) |>ungroup()reg_df <- main_df |>filter(year >2008)reg_df <- reg_df |>mutate(# Keep municipal types separate in by-type models.type_2 =case_when( type =="Muni"& home_rule_ind ==1~"HR_muni", type =="Muni"& home_rule_ind ==0~"NonHR_muni",TRUE~as.character(type) ),# Use a non-missing home-rule flag for year-by-home-rule fixed effects.home_rule_for_fe =replace_na(as.integer(home_rule_ind), 0L) )gov_types <-c("Other", "Township", "HR_muni", "NonHR_muni", "School")gov_types_B <-c("HR_muni", "NonHR_muni", "School")minor_types <-c("ELEMENTARY", "SECONDARY")gof_omit ="IC|Log|Adj|RMSE|Std.Errors"
Main paper tables
Table 1. Distribution of Percentage Changes in Levies and EAV
Code
# summarize d_levy and d_eav by type## Table 1. Distribution of Percentage Changes in Levies and EAVtable1 <- reg_df |>filter(year >=2009) |>mutate(agency_type =case_when( type =="Muni"~"All Munis", type =="School"~"Schools", type =="Township"~"Townships", type =="Other"~"Other Districts" ) ) |>select(agency_type, d_levy, d_eav) |>pivot_longer(cols =c(d_levy, d_eav),names_to ="stat",values_to ="value" ) |>group_by(agency_type, stat) |>summarize(N =sum(!is.na(value)),p5 =quantile(value, .05, na.rm =TRUE),p25 =quantile(value, .25, na.rm =TRUE),p50 =quantile(value, .50, na.rm =TRUE),p75 =quantile(value, .75, na.rm =TRUE),p95 =quantile(value, .95, na.rm =TRUE),.groups ="drop" )table1 |>gt() |>fmt_number(columns =c(p5, p25, p50, p75, p95),decimals =1 ) |>tab_header(title =md("**Table 1. Distribution of Percentage Changes in Levies and EAV**") )
Table 1. Distribution of Percentage Changes in Levies and EAV
agency_type
stat
N
p5
p25
p50
p75
p95
All Munis
d_eav
1605
−15.3
−6.9
−1.5
4.2
23.8
All Munis
d_levy
1601
−1.4
0.8
2.6
4.6
11.7
Other Districts
d_eav
2160
−16.1
−7.2
−1.6
4.2
24.0
Other Districts
d_levy
2160
−4.5
1.1
2.3
3.4
8.3
Schools
d_eav
1995
−14.8
−7.1
−1.6
4.1
23.3
Schools
d_levy
1995
−2.7
1.4
2.3
3.5
8.6
Townships
d_eav
420
−14.3
−7.2
−1.4
3.8
20.8
Townships
d_levy
420
−2.0
1.2
2.7
4.1
6.8
Table 2. All-agency OLS
“At the bottom of table 2, we also include our estimated “upper bound” for ε_b—this tells us the maximum value of the elasticity that we fail to reject with 95 percent confidence—i.e. we can reject the hypothesis that ε_b is greater than the upper bound with 95 percent confidence. As shown in the table, even these upper bounds are quite small and always much less than 1.”
Code
all_ols_1 <-feols(d_levy ~ d_eav,data = reg_df, cluster = vcov_uid)all_ols_2 <-feols(d_levy ~ d_eav | year^home_rule_for_fe,data = reg_df, cluster = vcov_uid)all_ols_3 <-feols(d_levy ~ d_eav | year^home_rule_for_fe + n_uniqueid,data = reg_df, cluster = vcov_uid)all_ols_models_v22 <-list(M1 = all_ols_1, M2 = all_ols_2, M3 = all_ols_3)save_table( all_ols_models_v22,file_stub ="v22_table_02_OLS_all_agencies",title ="Table 2: All agencies OLS Predict levy using d_eav",notes =c("Cook County, Illinois data from 2008 through 2023.","Columns 2 and 3 include year-by-home-rule fixed effects; column 3 includes unit fixed effects." ),coef_map =c("d_eav"="Change in EAV"))save_df_table(bind_rows(term_stats(all_ols_1, "d_eav", "M1"),term_stats(all_ols_2, "d_eav", "M2"),term_stats(all_ols_3, "d_eav", "M3") ),"v22_table_02_OLS_all_agencies_upper_bounds","Table 2: Upper bounds for all-agency OLS")# ================================================================
Code
display_model_table("v22_table_02_OLS_all_agencies",title ="Table 2. All-agency OLS estimates",notes =c("Cook County, Illinois data from 2008 through 2023.","Columns 2 and 3 include year-by-home-rule fixed effects; column 3 includes unit fixed effects." ),coef_map =c("d_eav"="Change in EAV"))
Table 2. All-agency OLS estimates
M1
M2
M3
* p < 0.1, ** p < 0.05, *** p < 0.01
Cook County, Illinois data from 2008 through 2023.
Columns 2 and 3 include year-by-home-rule fixed effects; column 3 includes unit fixed effects.
Change in EAV
0.072***
0.089***
0.074***
(0.010)
(0.025)
(0.021)
Num.Obs.
6176
6176
6174
R2
0.004
0.016
0.046
R2 Within
0.002
0.002
FE: year^home_rule_for_fe
X
X
FE: n_uniqueid
X
Code
display_df_table("v22_table_02_OLS_all_agencies_upper_bounds",title ="Upper-bound summary for Table 2")
Upper-bound summary for Table 2
model
N
estimate
std_error
upper_bound
p_value
M1
NA
0.072
0.010
0.089
0.000
M2
NA
0.089
0.025
0.130
0.000
M3
NA
0.074
0.021
0.109
0.001
Table 3. All-agency IV
“In table 3 we treat the change in the tax base (d_eav) as endogenous and instrument for it using the timing of reassessments. For the timing of reassessments to be a valid instrument for the change in the tax base requires that (i) reassessments are a strong predictor of changes in EAV and (ii) reassessments do not influence the change in the levy except to the extent that they affect the change in the tax base.”
Code
library(fixest)library(tibble)# -----------------------------# 1. Run IV models# -----------------------------all_iv_1 <-feols( d_levy ~1|0| d_eav ~ reassess_year,data = reg_df,cluster = vcov_uid)all_iv_2 <-feols( d_levy ~1| year^home_rule_for_fe | d_eav ~ reassess_year,data = reg_df,cluster = vcov_uid)all_iv_3 <-feols( d_levy ~1| year^home_rule_for_fe + n_uniqueid | d_eav ~ reassess_year,data = reg_df,cluster = vcov_uid)all_iv_models_v22 <-list( all_iv_1, all_iv_2, all_iv_3)modelsummary(list(M1 = all_iv_1, M2 = all_iv_2, M3 = all_iv_3 ),gof_omit = gof_omit,coef_map =c("fit_d_eav"="Change in EAV"),file_stub ="IV_all_agencies",title ="Table X: IV Predict levy using d_eav",notes =c("Cook County, Illinois data from 2008 through 2023.","Columns 2, 3, and 4 include year fixed effects; column 4 includes unit fixed effects.","d_eav is treated as endogenous and instrumented by reassessment year." ))
Table X: IV Predict levy using d_eav
M1
M2
M3
Cook County, Illinois data from 2008 through 2023.
Columns 2, 3, and 4 include year fixed effects; column 4 includes unit fixed effects.
d_eav is treated as endogenous and instrumented by reassessment year.
Change in EAV
-0.010
-0.085
-0.086
(0.031)
(0.062)
(0.062)
Num.Obs.
6176
6176
6174
R2
0.000
0.014
0.045
R2 Within
0.000
0.000
FE: year^home_rule_for_fe
X
X
FE: n_uniqueid
X
upper bound for ε_b allows us to rule out all but tiny values for this elasticity
upper_bound=_b[d_eav]+(1.645 * _se[d_eav])
The p-exog statistic is the p value for a test of the hypothesis that d_eav is exogenous
We also report the F statistics from the first stage regressions to predict d_eav.
# save_table(# all_iv_models_v22,# file_stub = "v22_table_03_IV_all_agencies",# title = "Table 3: All agencies IV Predict levy using d_eav",# notes = c(# "Cook County, Illinois data from 2008 through 2023.",# "Columns 2 and 3 include year-by-home-rule fixed effects; column 3 includes unit fixed effects.",# "d_eav is treated as endogenous and instrumented by reassessment year."# ),# coef_map = c("fit_d_eav" = "Change in EAV")# )# # save_df_table(# bind_rows(# term_stats(all_iv_1, "fit_d_eav", "M1"),# term_stats(all_iv_2, "fit_d_eav", "M2"),# term_stats(all_iv_3, "fit_d_eav", "M3")# ) |># mutate(first_stage_F = c(# safe_first_stage_f(all_iv_1), # safe_first_stage_f(all_iv_2), # safe_first_stage_f(all_iv_3))),# "v22_table_03_IV_all_agencies_upper_bounds",# "Table 3: Upper bounds for all-agency IV"# )# display_model_table(# "v22_table_03_IV_all_agencies",# title = "Table 3. All-agency IV estimates",# notes = c(# "Cook County, Illinois data from 2008 through 2023.",# "Columns 2 and 3 include year-by-home-rule fixed effects; column 3 includes unit fixed effects.",# "Change in EAV is treated as endogenous and instrumented by reassessment year."# ),# coef_map = c("fit_d_eav" = "Change in EAV")# )# # display_df_table(# "v22_table_03_IV_all_agencies_upper_bounds",# title = "Upper-bound summary for Table 3"# )
Table 4 & 5?. By agency type: OLS
Code
m_ols_3 <-feols(d_levy ~ d_eav | year + n_uniqueid, data = reg_df, cluster = vcov_uid)m_iv_3 <-feols(d_levy ~1| year + n_uniqueid | d_eav ~ reassess_year, data = reg_df, cluster = vcov_uid)modelsummary(list(m_ols_3, m_iv_3), stars =TRUE, gof_omit= gof_omit)
Table 1: Compares output for the tax base elasticity using taxing agency and tax year fixed effects with OLS and IV models
Table 2: Compares output for the tax base elasticity for each type of taxing agency using taxing agency and tax year fixed effects with OLS and IV models. Matches Values in A2 and A3 for the 3rd row that uses TWFE.
sample: Full sample
sample: HR_muni
sample: NonHR_muni
sample: Other
sample: School
sample: Township
+ p < 0.1, * p < 0.05, ** p < 0.01, *** p < 0.001
d_eav
0.073***
0.073
-0.052
0.085*
0.102*
0.010
(0.021)
(0.046)
(0.048)
(0.036)
(0.040)
(0.029)
Num.Obs.
6174
1030
571
2158
1995
420
R2
0.042
0.188
0.078
0.036
0.151
0.154
R2 Within
0.002
0.010
0.001
0.001
0.026
0.000
FE: year
X
X
X
X
X
X
FE: n_uniqueid
X
X
X
X
X
X
sample: Full sample
sample: HR_muni
sample: NonHR_muni
sample: Other
sample: School
sample: Township
+ p < 0.1, * p < 0.05, ** p < 0.01, *** p < 0.001
fit_d_eav
-0.085
-0.007
-0.060
-0.201
0.011
-0.065
(0.063)
(0.070)
(0.135)
(0.174)
(0.033)
(0.089)
Num.Obs.
6174
1030
571
2158
1995
420
R2
0.040
0.180
0.077
0.036
0.128
0.155
R2 Within
0.000
0.000
0.000
0.001
0.000
0.001
FE: year
X
X
X
X
X
X
FE: n_uniqueid
X
X
X
X
X
X
Upper bound estimates, all model specifications
Code
# ================================================================run_type_v22 <-function(df, gov, iv =FALSE) { d <- df |>filter(type_2 == gov)if (!iv) { m1 <-feols(d_levy ~ d_eav, data = d, cluster = vcov_uid) m2 <-feols(d_levy ~ d_eav | year, data = d, cluster = vcov_uid) m3 <-feols(d_levy ~ d_eav | year + n_uniqueid, data = d, cluster = vcov_uid)return(list(m1 = m1, m2 = m2, m3 = m3)) } m1 <-feols(d_levy ~1|0| d_eav ~ reassess_year, data = d, cluster = vcov_uid) m2 <-feols(d_levy ~1| year | d_eav ~ reassess_year, data = d, cluster = vcov_uid) m3 <-feols(d_levy ~1| year + n_uniqueid | d_eav ~ reassess_year, data = d, cluster = vcov_uid)list(m1 = m1, m2 = m2, m3 = m3)}run_type_B_v22 <-function(df, gov, iv =FALSE) { d <- df |>filter(type_2 == gov)if (!iv) { m4 <-feols(d_levy ~ d_eav + d_total_ig_revenue | year + n_uniqueid, data = d, cluster = vcov_uid) idx <-sample_index(m4, d) m5 <-feols(d_levy ~ d_eav | year + n_uniqueid, data = d[idx, ], cluster = vcov_uid)return(list(m4 = m4, m5 = m5)) } m4 <-feols(d_levy ~ d_total_ig_revenue | year + n_uniqueid | d_eav ~ reassess_year, data = d, cluster = vcov_uid) idx <-sample_index(m4, d) m5 <-feols(d_levy ~1| year + n_uniqueid | d_eav ~ reassess_year, data = d[idx, ], cluster = vcov_uid)list(m4 = m4, m5 = m5)}school_extra_v22 <-function(df, iv =FALSE) { d <- df |>filter(type_2 =="School")if (!iv) {return(feols(d_levy ~ d_eav + d_enrollment | year + n_uniqueid, data = d, cluster = vcov_uid)) }feols(d_levy ~ d_enrollment | year + n_uniqueid | d_eav ~ reassess_year, data = d, cluster = vcov_uid)}make_by_type_summary <-function(models_A, models_B, school_extra, iv =FALSE) { term <-if (iv) "fit_d_eav"else"d_eav" rows <-list()for (spec inpaste0("m", 1:3)) { rows[[spec]] <-map_dfr(gov_types, function(gov) {term_stats(models_A[[gov]][[spec]], term, gov) |>transmute(row = spec, agency = model, N, upper_bound, estimate, std_error, p_value) }) }for (spec inpaste0("m", 4:5)) { rows[[spec]] <-map_dfr(gov_types_B, function(gov) {term_stats(models_B[[gov]][[spec]], term, gov) |>transmute(row = spec, agency = model, N, upper_bound, estimate, std_error, p_value) }) } rows[["m6"]] <-term_stats(school_extra, term, "School") |>transmute(row ="m6", agency = model, N, upper_bound, estimate, std_error, p_value)bind_rows(rows) |>mutate(agency =agency_label(agency),row =recode(row,m1 ="No controls",m2 ="Year FE",m3 ="Year + unit FE",m4 ="IG revenue + year + unit FE",m5 ="Same sample as IG row, no IG control",m6 ="Enrollment + year + unit FE" ))}ols_type_A <-setNames(map(gov_types, ~run_type_v22(reg_df, .x, iv =FALSE)), gov_types)ols_type_B <-setNames(map(gov_types_B, ~run_type_B_v22(reg_df, .x, iv =FALSE)), gov_types_B)ols_school_extra <-school_extra_v22(reg_df, iv =FALSE)iv_type_A <-setNames(map(gov_types, ~run_type_v22(reg_df, .x, iv =TRUE)), gov_types)iv_type_B <-setNames(map(gov_types_B, ~run_type_B_v22(reg_df, .x, iv =TRUE)), gov_types_B)iv_school_extra <-school_extra_v22(reg_df, iv =TRUE)ols_by_type_summary <-make_by_type_summary(ols_type_A, ols_type_B, ols_school_extra, iv =FALSE)iv_by_type_summary <-make_by_type_summary(iv_type_A, iv_type_B, iv_school_extra, iv =TRUE)# # save_df_table(ols_by_type_summary, "v22_table_04_OLS_by_type_upper_bounds", "Table 4: By agency type OLS upper-bound estimates")# save_df_table(ols_by_type_summary |> select(row, agency, N, estimate, std_error, p_value), "v22_table_A2_OLS_by_type_point_estimates", "Table A2: By agency type OLS point estimates")# # # save_df_table(iv_by_type_summary, "v22_table_05_IV_by_type_upper_bounds", "Table 5: By agency type IV upper-bound estimates")# save_df_table(iv_by_type_summary |> select(row, agency, N, estimate, std_error, p_value), "v22_table_A3_IV_by_type_point_estimates", "Table A3: By agency type IV point estimates")
Code
display_df_table("v22_table_04_OLS_by_type_upper_bounds",title ="Table 4. By agency type OLS upper-bound estimates")
Table 4. By agency type OLS upper-bound estimates
row
agency
N
upper_bound
estimate
std_error
p_value
No controls
Other
NA
0.123
0.093
0.018
0.000
No controls
Townships
NA
0.052
0.006
0.028
0.835
No controls
Home-rule municipalities
NA
0.062
0.018
0.026
0.485
No controls
Non-home-rule municipalities
NA
0.075
0.039
0.022
0.079
No controls
Schools
NA
0.126
0.096
0.018
0.000
Year FE
Other
NA
0.180
0.109
0.043
0.012
Year FE
Townships
NA
0.057
0.010
0.029
0.737
Year FE
Home-rule municipalities
NA
0.163
0.079
0.051
0.117
Year FE
Non-home-rule municipalities
NA
0.044
-0.036
0.048
0.460
Year FE
Schools
NA
0.187
0.114
0.044
0.009
Year + unit FE
Other
NA
0.144
0.085
0.036
0.018
Year + unit FE
Townships
NA
0.058
0.010
0.029
0.741
Year + unit FE
Home-rule municipalities
NA
0.148
0.073
0.046
0.115
Year + unit FE
Non-home-rule municipalities
NA
0.026
-0.052
0.048
0.272
Year + unit FE
Schools
NA
0.167
0.102
0.040
0.010
IG revenue + year + unit FE
Home-rule municipalities
NA
0.412
0.228
0.112
0.041
IG revenue + year + unit FE
Non-home-rule municipalities
NA
0.379
0.139
0.146
0.342
IG revenue + year + unit FE
Schools
NA
0.265
0.157
0.066
0.018
Same sample as IG row, no IG control
Home-rule municipalities
NA
0.410
0.228
0.111
0.040
Same sample as IG row, no IG control
Non-home-rule municipalities
NA
0.348
0.127
0.135
0.346
Same sample as IG row, no IG control
Schools
NA
0.264
0.156
0.066
0.018
Enrollment + year + unit FE
Schools
NA
0.264
0.155
0.066
0.019
Code
display_df_table("v22_table_05_IV_by_type_upper_bounds",title ="Table 5. By agency type IV upper-bound estimates")
Table 5. By agency type IV upper-bound estimates
row
agency
N
upper_bound
estimate
std_error
p_value
No controls
Other
NA
0.079
-0.052
0.080
0.512
No controls
Townships
NA
0.042
-0.058
0.061
0.341
No controls
Home-rule municipalities
NA
0.036
-0.037
0.044
0.406
No controls
Non-home-rule municipalities
NA
0.061
-0.029
0.055
0.594
No controls
Schools
NA
0.108
0.065
0.026
0.013
Year FE
Other
NA
0.085
-0.201
0.174
0.248
Year FE
Townships
NA
0.082
-0.065
0.089
0.465
Year FE
Home-rule municipalities
NA
0.108
-0.007
0.070
0.919
Year FE
Non-home-rule municipalities
NA
0.165
-0.052
0.132
0.691
Year FE
Schools
NA
0.065
0.011
0.033
0.733
Year + unit FE
Other
NA
0.085
-0.201
0.174
0.248
Year + unit FE
Townships
NA
0.082
-0.065
0.089
0.465
Year + unit FE
Home-rule municipalities
NA
0.107
-0.007
0.070
0.914
Year + unit FE
Non-home-rule municipalities
NA
0.163
-0.060
0.135
0.658
Year + unit FE
Schools
NA
0.065
0.011
0.033
0.741
IG revenue + year + unit FE
Home-rule municipalities
NA
0.302
-0.240
0.330
0.466
IG revenue + year + unit FE
Non-home-rule municipalities
NA
0.339
-0.141
0.292
0.629
IG revenue + year + unit FE
Schools
NA
0.128
-0.037
0.100
0.714
Same sample as IG row, no IG control
Home-rule municipalities
NA
0.300
-0.243
0.330
0.462
Same sample as IG row, no IG control
Non-home-rule municipalities
NA
0.323
-0.142
0.283
0.616
Same sample as IG row, no IG control
Schools
NA
0.130
-0.035
0.101
0.728
Enrollment + year + unit FE
Schools
NA
0.121
-0.045
0.101
0.658
Table 6 & 7. All-agency asymmetric models
TWFE specifications
Code
# my way of coding itreg_df <- reg_df |>mutate(eav_growth =case_when( d_eav >0~"Increase", d_eav <0~"Decrease",TRUE~"No Change"))reg_B <-feols(d_levy ~ d_eav:eav_growth | year + n_uniqueid, data = reg_df, cluster = vcov_uid)reg_B |>summary()
make_asym_by_type_summary <-function(models_A, models_B, school_extra, iv =FALSE) { term_pos <-if (iv) "fit_pos_d_eav"else"pos_d_eav" term_neg <-if (iv) "fit_neg_d_eav"else"neg_d_eav" rows <-list()for (spec inpaste0("m", 1:3)) { rows[[spec]] <-map_dfr(gov_types, function(gov) { m <- models_A[[gov]][[spec]]term_stats(m, term_pos, gov) |>transmute(row = spec, agency = model, N, upper_bound, estimate, std_error, p_value, p_equal =p_equal_terms(m, term_neg, term_pos)) }) }for (spec inpaste0("m", 4:5)) { rows[[spec]] <-map_dfr(gov_types_B, function(gov) { m <- models_B[[gov]][[spec]]term_stats(m, term_pos, gov) |>transmute(row = spec, agency = model, N, upper_bound, estimate, std_error, p_value, p_equal =p_equal_terms(m, term_neg, term_pos)) }) } rows[["m6"]] <-term_stats(school_extra, term_pos, "School") |>transmute(row ="m6", agency = model, N, upper_bound, estimate, std_error, p_value, p_equal =p_equal_terms(school_extra, term_neg, term_pos))bind_rows(rows) |>mutate(agency =agency_label(agency),row =recode(row,m1 ="No controls",m2 ="Year FE",m3 ="Year + unit FE",m4 ="IG revenue + year + unit FE",m5 ="Same sample as IG row, no IG control",m6 ="Enrollment + year + unit FE" ))}asym_ols_type_A <-setNames(map(gov_types, ~run_asym_type_v22(reg_df, .x, iv =FALSE)), gov_types)asym_ols_type_B <-setNames(map(gov_types_B, ~run_asym_type_B_v22(reg_df, .x, iv =FALSE)), gov_types_B)asym_ols_school_extra <-asym_school_extra_v22(reg_df, iv =FALSE)asym_iv_type_A <-setNames(map(gov_types, ~run_asym_type_v22(reg_df, .x, iv =TRUE)), gov_types)asym_iv_type_B <-setNames(map(gov_types_B, ~run_asym_type_B_v22(reg_df, .x, iv =TRUE)), gov_types_B)asym_iv_school_extra <-asym_school_extra_v22(reg_df, iv =TRUE)asym_ols_by_type_summary <-make_asym_by_type_summary(asym_ols_type_A, asym_ols_type_B, asym_ols_school_extra, iv =FALSE)asym_iv_by_type_summary <-make_asym_by_type_summary(asym_iv_type_A, asym_iv_type_B, asym_iv_school_extra, iv =TRUE)save_df_table(asym_ols_by_type_summary, "v22_table_08_OLS_by_type_asym_upper_bounds", "Table 8: OLS upper-bound estimates allowing for asymmetry")save_df_table(asym_ols_by_type_summary |>select(row, agency, p_equal), "v22_table_A4_OLS_by_type_asym_p_equal", "Table A4: P-values for OLS symmetry tests")save_df_table(asym_ols_by_type_summary |>select(row, agency, N, estimate, std_error, p_value), "v22_table_A5_OLS_by_type_asym_point_estimates", "Table A5: OLS point estimates for positive EAV changes")save_df_table(asym_iv_by_type_summary, "v22_table_09_IV_by_type_asym_upper_bounds", "Table 9: IV upper-bound estimates allowing for asymmetry")save_df_table(asym_iv_by_type_summary |>select(row, agency, p_equal), "v22_table_A6_IV_by_type_asym_p_equal", "Table A6: P-values for IV symmetry tests")save_df_table(asym_iv_by_type_summary |>select(row, agency, N, estimate, std_error, p_value), "v22_table_A7_IV_by_type_asym_point_estimates", "Table A7: IV point estimates for positive EAV changes")
WRONG: FIX SOON
Code
display_df_table("v22_table_08_OLS_by_type_asym_upper_bounds",title ="Table 8. OLS upper-bound estimates allowing for asymmetry")
Table 8. OLS upper-bound estimates allowing for asymmetry
row
agency
N
upper_bound
estimate
std_error
p_value
p_equal
No controls
Other
NA
0.097
0.068
0.017
0.000
NA
No controls
Townships
NA
0.097
0.068
0.017
0.000
NA
No controls
Home-rule municipalities
NA
0.097
0.068
0.017
0.000
NA
No controls
Non-home-rule municipalities
NA
0.097
0.068
0.017
0.000
NA
No controls
Schools
NA
0.097
0.068
0.017
0.000
NA
Year FE
Other
NA
0.149
0.091
0.035
0.010
NA
Year FE
Townships
NA
0.149
0.091
0.035
0.010
NA
Year FE
Home-rule municipalities
NA
0.149
0.091
0.035
0.010
NA
Year FE
Non-home-rule municipalities
NA
0.149
0.091
0.035
0.010
NA
Year FE
Schools
NA
0.149
0.091
0.035
0.010
NA
Year + unit FE
Other
NA
0.137
0.081
0.034
0.017
NA
Year + unit FE
Townships
NA
0.137
0.081
0.034
0.017
NA
Year + unit FE
Home-rule municipalities
NA
0.137
0.081
0.034
0.017
NA
Year + unit FE
Non-home-rule municipalities
NA
0.137
0.081
0.034
0.017
NA
Year + unit FE
Schools
NA
0.137
0.081
0.034
0.017
NA
IG revenue + year + unit FE
Home-rule municipalities
NA
0.565
0.295
0.164
0.072
NA
IG revenue + year + unit FE
Non-home-rule municipalities
NA
0.528
0.211
0.193
0.275
NA
IG revenue + year + unit FE
Schools
NA
0.331
0.175
0.095
0.065
NA
Same sample as IG row, no IG control
Home-rule municipalities
NA
0.562
0.295
0.163
0.070
NA
Same sample as IG row, no IG control
Non-home-rule municipalities
NA
0.508
0.197
0.189
0.297
NA
Same sample as IG row, no IG control
Schools
NA
0.330
0.175
0.095
0.065
NA
Enrollment + year + unit FE
Schools
NA
0.330
0.174
0.095
0.068
NA
Code
display_df_table("v22_table_09_IV_by_type_asym_upper_bounds",title ="Table 9. IV upper-bound estimates allowing for asymmetry")
Table 9. IV upper-bound estimates allowing for asymmetry
row
agency
N
upper_bound
estimate
std_error
p_value
p_equal
No controls
Other
NA
0.043
0.014
0.018
0.442
NA
No controls
Townships
NA
0.043
0.014
0.018
0.442
NA
No controls
Home-rule municipalities
NA
0.043
0.014
0.018
0.442
NA
No controls
Non-home-rule municipalities
NA
0.043
0.014
0.018
0.442
NA
No controls
Schools
NA
0.043
0.014
0.018
0.442
NA
Year FE
Other
NA
0.107
0.037
0.043
0.386
NA
Year FE
Townships
NA
0.107
0.037
0.043
0.386
NA
Year FE
Home-rule municipalities
NA
0.107
0.037
0.043
0.386
NA
Year FE
Non-home-rule municipalities
NA
0.107
0.037
0.043
0.386
NA
Year FE
Schools
NA
0.107
0.037
0.043
0.386
NA
Year + unit FE
Other
NA
0.090
0.028
0.038
0.460
NA
Year + unit FE
Townships
NA
0.090
0.028
0.038
0.460
NA
Year + unit FE
Home-rule municipalities
NA
0.090
0.028
0.038
0.460
NA
Year + unit FE
Non-home-rule municipalities
NA
0.090
0.028
0.038
0.460
NA
Year + unit FE
Schools
NA
0.090
0.028
0.038
0.460
NA
IG revenue + year + unit FE
Home-rule municipalities
NA
0.038
-0.112
0.091
0.220
NA
IG revenue + year + unit FE
Non-home-rule municipalities
NA
0.574
0.154
0.255
0.547
NA
IG revenue + year + unit FE
Schools
NA
0.046
-0.009
0.034
0.780
NA
Same sample as IG row, no IG control
Home-rule municipalities
NA
0.039
-0.110
0.091
0.223
NA
Same sample as IG row, no IG control
Non-home-rule municipalities
NA
0.532
0.138
0.239
0.563
NA
Same sample as IG row, no IG control
Schools
NA
0.045
-0.010
0.034
0.772
NA
Enrollment + year + unit FE
Schools
NA
0.044
-0.011
0.033
0.746
NA
Table 10 & 11. Lagged EAV models
Code
# ================================================================# Tables 10/11/A8/A9. Lagged OLS models# ================================================================reg_df <- reg_df |>group_by(n_agency_group) |>arrange(year, .by_group =TRUE) |>mutate(d_2_eav =100*log((lag_av * lag_eq_factor_final) / (lag2_av * lag2_eq_factor_final)),d_3_eav =100*log((lag2_av * lag2_eq_factor_final) / (lag3_av * lag3_eq_factor_final)) ) |>ungroup()lag_all_ols_1 <-feols(d_levy ~ d_eav + d_2_eav + d_3_eav, data = reg_df, cluster = vcov_uid)lag_all_ols_2 <-feols(d_levy ~ d_eav + d_2_eav + d_3_eav | year^home_rule_for_fe, data = reg_df, cluster = vcov_uid)lag_all_ols_3 <-feols(d_levy ~ d_eav + d_2_eav + d_3_eav | year^home_rule_for_fe + n_uniqueid, data = reg_df, cluster = vcov_uid)save_table(list(M1 = lag_all_ols_1, M2 = lag_all_ols_2, M3 = lag_all_ols_3),file_stub ="v22_table_10_OLS_all_agencies_lagged",title ="Table 10: All agencies OLS allowing for two lags of d_eav",coef_map =c("d_eav"="Current EAV change", "d_2_eav"="Lag 1 EAV change", "d_3_eav"="Lag 2 EAV change"))save_df_table(bind_rows(lincom_sum(lag_all_ols_1, c("d_eav", "d_2_eav", "d_3_eav"), "M1"),lincom_sum(lag_all_ols_2, c("d_eav", "d_2_eav", "d_3_eav"), "M2"),lincom_sum(lag_all_ols_3, c("d_eav", "d_2_eav", "d_3_eav"), "M3") ),"v22_table_10_OLS_all_agencies_lagged_sums","Table 10: Sum of current and lagged EAV effects")run_lag_type_v22 <-function(df, gov) { d <- df |>filter(type_2 == gov) m1 <-feols(d_levy ~ d_eav + d_2_eav + d_3_eav, data = d, cluster = vcov_uid) m2 <-feols(d_levy ~ d_eav + d_2_eav + d_3_eav | year, data = d, cluster = vcov_uid) m3 <-feols(d_levy ~ d_eav + d_2_eav + d_3_eav | year + n_uniqueid, data = d, cluster = vcov_uid)list(m1 = m1, m2 = m2, m3 = m3)}run_lag_type_B_v22 <-function(df, gov) { d <- df |>filter(type_2 == gov) m4 <-feols(d_levy ~ d_eav + d_2_eav + d_3_eav + d_total_ig_revenue | year + n_uniqueid, data = d, cluster = vcov_uid) idx <-sample_index(m4, d) m5 <-feols(d_levy ~ d_eav + d_2_eav + d_3_eav | year + n_uniqueid, data = d[idx, ], cluster = vcov_uid)list(m4 = m4, m5 = m5)}lag_school_extra_v22 <-function(df) { d <- df |>filter(type_2 =="School")feols(d_levy ~ d_eav + d_2_eav + d_3_eav + d_enrollment | year + n_uniqueid, data = d, cluster = vcov_uid)}make_lag_by_type_summary <-function(models_A, models_B, school_extra) { rows <-list()for (spec inpaste0("m", 1:3)) { rows[[spec]] <-map_dfr(gov_types, function(gov) {lincom_sum(models_A[[gov]][[spec]], c("d_eav", "d_2_eav", "d_3_eav"), gov) |>transmute(row = spec, agency = model, N, A_upper_bound, lagged_magnitude, std_error, lagged_p) }) }for (spec inpaste0("m", 4:5)) { rows[[spec]] <-map_dfr(gov_types_B, function(gov) {lincom_sum(models_B[[gov]][[spec]], c("d_eav", "d_2_eav", "d_3_eav"), gov) |>transmute(row = spec, agency = model, N, A_upper_bound, lagged_magnitude, std_error, lagged_p) }) } rows[["m6"]] <-lincom_sum(school_extra, c("d_eav", "d_2_eav", "d_3_eav"), "School") |>transmute(row ="m6", agency = model, N, A_upper_bound, lagged_magnitude, std_error, lagged_p)bind_rows(rows) |>mutate(agency =agency_label(agency),row =recode(row,m1 ="No controls",m2 ="Year FE",m3 ="Year + unit FE",m4 ="IG revenue + year + unit FE",m5 ="Same sample as IG row, no IG control",m6 ="Enrollment + year + unit FE" ))}lag_type_A <-setNames(map(gov_types, ~run_lag_type_v22(reg_df, .x)), gov_types)lag_type_B <-setNames(map(gov_types_B, ~run_lag_type_B_v22(reg_df, .x)), gov_types_B)lag_school_extra <-lag_school_extra_v22(reg_df)lag_by_type_summary <-make_lag_by_type_summary(lag_type_A, lag_type_B, lag_school_extra)save_df_table(lag_by_type_summary, "v22_table_11_OLS_by_type_lagged_upper_bounds", "Table 11: OLS upper-bound estimates allowing for two lags of d_eav")save_df_table(lag_by_type_summary |>select(row, agency, N, lagged_p), "v22_table_A8_OLS_by_type_lagged_p_values", "Table A8: P-values for lagged effects")save_df_table(lag_by_type_summary |>select(row, agency, N, lagged_magnitude, std_error, lagged_p), "v22_table_A9_OLS_by_type_lagged_point_estimates", "Table A9: Sum of current and lagged EAV coefficients")
Code
display_model_table("v22_table_10_OLS_all_agencies_lagged",title ="Table 10. All-agency OLS estimates with lagged EAV changes",coef_map =c("d_eav"="Change in EAV", "d_2_eav"="One-year lag", "d_3_eav"="Two-year lag"))
Table 10. All-agency OLS estimates with lagged EAV changes
M1
M2
M3
* p < 0.1, ** p < 0.05, *** p < 0.01
Change in EAV
0.077***
0.121***
0.100***
(0.011)
(0.034)
(0.032)
One-year lag
-0.037
0.050
0.026
(0.031)
(0.031)
(0.033)
Two-year lag
0.079**
0.136**
0.116
(0.037)
(0.066)
(0.071)
Num.Obs.
6176
6176
6174
R2
0.008
0.019
0.048
R2 Within
0.006
0.004
ub_d_eav
0.0954438446626904
0.176443184560096
0.153626531647265
FE: year^home_rule_for_fe
X
X
FE: n_uniqueid
X
Code
display_df_table("v22_table_10_OLS_all_agencies_lagged_sums",title ="Lagged-effect summary for Table 10")
Lagged-effect summary for Table 10
model
N
lagged_magnitude
std_error
A_upper_bound
lagged_p
M1
NA
0.120
0.019
0.152
0.000
M2
NA
0.306
0.112
0.490
0.006
M3
NA
0.242
0.120
0.440
0.044
Code
display_df_table("v22_table_11_OLS_by_type_lagged_upper_bounds",title ="Table 11. By agency type lagged EAV estimates")
Table 11. By agency type lagged EAV estimates
row
agency
N
A_upper_bound
lagged_magnitude
std_error
lagged_p
No controls
Other
NA
0.240
0.170
0.043
0.000
No controls
Townships
NA
0.093
0.051
0.026
0.047
No controls
Home-rule municipalities
NA
0.142
0.078
0.039
0.043
No controls
Non-home-rule municipalities
NA
0.136
0.065
0.043
0.135
No controls
Schools
NA
0.149
0.114
0.021
0.000
Year FE
Other
NA
0.787
0.388
0.242
0.109
Year FE
Townships
NA
0.185
0.014
0.104
0.896
Year FE
Home-rule municipalities
NA
0.430
0.142
0.175
0.418
Year FE
Non-home-rule municipalities
NA
0.449
0.236
0.130
0.069
Year FE
Schools
NA
0.478
0.343
0.082
0.000
Year + unit FE
Other
NA
0.736
0.300
0.265
0.257
Year + unit FE
Townships
NA
0.272
0.049
0.135
0.715
Year + unit FE
Home-rule municipalities
NA
0.437
0.175
0.159
0.270
Year + unit FE
Non-home-rule municipalities
NA
0.397
0.166
0.141
0.239
Year + unit FE
Schools
NA
0.385
0.257
0.078
0.001
IG revenue + year + unit FE
Home-rule municipalities
NA
0.837
0.413
0.257
0.108
IG revenue + year + unit FE
Non-home-rule municipalities
NA
0.424
0.066
0.218
0.760
IG revenue + year + unit FE
Schools
NA
0.438
0.280
0.096
0.004
Same sample as IG row, no IG control
Home-rule municipalities
NA
0.837
0.413
0.258
0.109
Same sample as IG row, no IG control
Non-home-rule municipalities
NA
0.363
0.042
0.195
0.828
Same sample as IG row, no IG control
Schools
NA
0.436
0.278
0.096
0.004
Enrollment + year + unit FE
Schools
NA
0.433
0.278
0.095
0.003
Appendix tables
Appendix 1
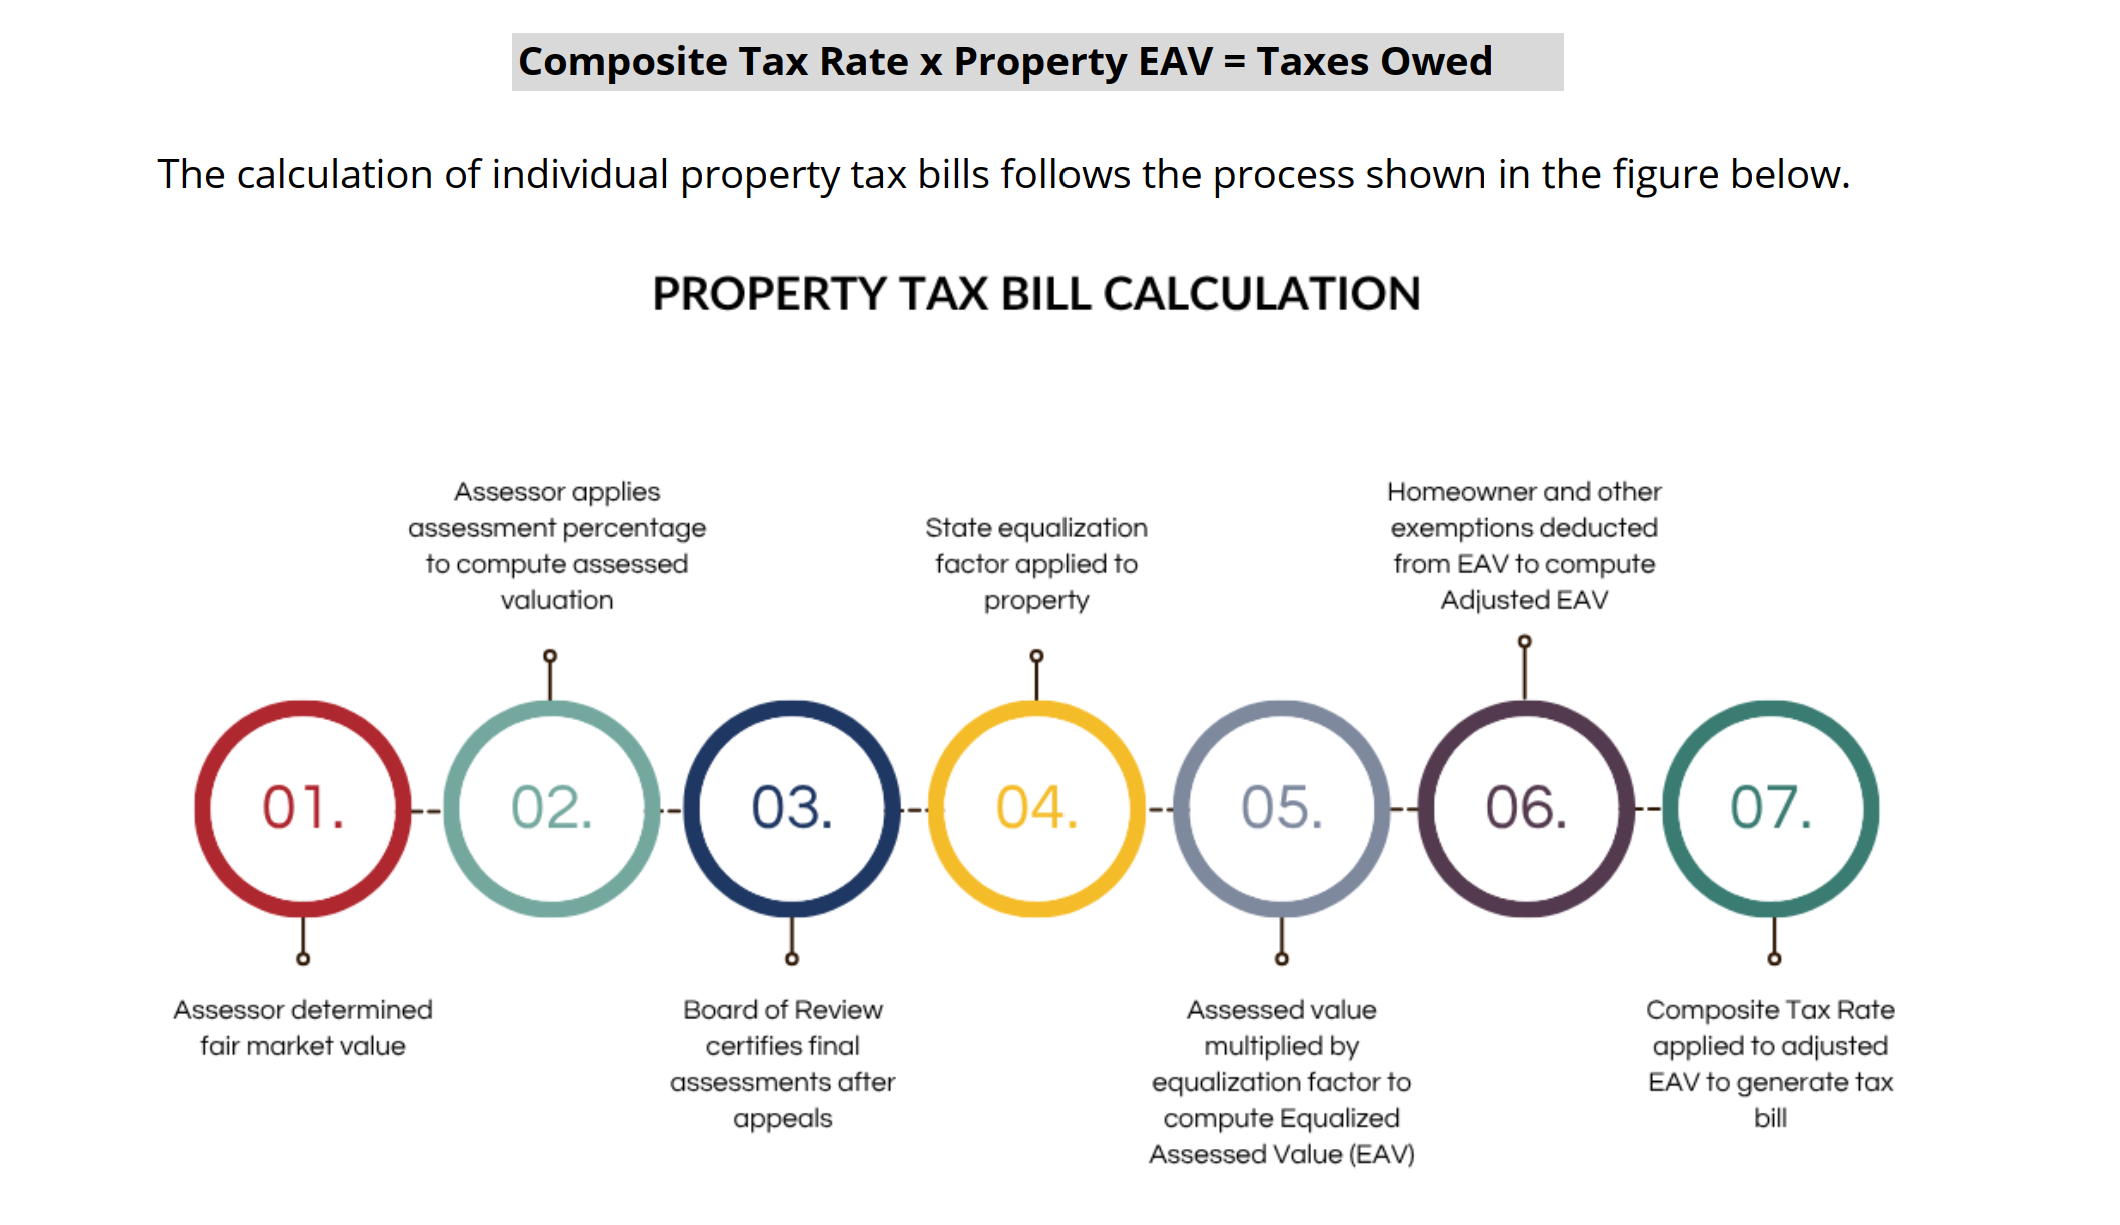
Source: Civic Federation Property Tax Primer
Appendix 2: Instrument validity
With two-way FE, your identifying variation becomes: deviations from unit-specific mean and year-specific shocks
So the question becomes:conditional on unit and year shocks, does reassessment timing still move EAV, and only through EAV?
We use these (exogenously determined) reassessment years as an “instrument” which purges observed changes in the tax base of the component that is predictable because of the re-assessment year.
If you test the instrument in a different specification (say no fixed effects), you are asking a different question:
Without FE: “Is reassessment year correlated with raw variation in EAV?”
With FE: “Is reassessment year correlated with within-unit deviations from trend in EAV?”
The code below creates the instrument-validity table. The combined municipality column is labeled All Munis.
Code
instrument_df <- main_df |>filter(year >2008)table(instrument_df$year) # 2009 through 2023
# homerule and nonhomerule munis and drop other types.feols(d_eav ~ reassess_year | year + uniqueid,data = instrument_df |>filter(type =="Muni"),cluster = vcov_uid,fsplit =~home_rule_ind)
all_instrument <-feols(d_eav ~ reassess_year| year + uniqueid,data = instrument_df, cluster = vcov_uid)muni_instrument <-feols(d_eav ~ reassess_year| year + uniqueid,data =filter(instrument_df, type =="Muni"),cluster = vcov_uid)other_instrument <-feols(d_eav ~ reassess_year | year + uniqueid,data =filter(instrument_df, type =="Other"),cluster = vcov_uid)school_instrument <-feols(d_eav ~ reassess_year| year + uniqueid,data =filter(instrument_df, type =="School"),cluster = vcov_uid)township_instrument <-feols(d_eav ~ reassess_year| year + uniqueid,data =filter(instrument_df, type =="Township"),cluster = vcov_uid)# # save_table(# list(# "All agencies" = all_instrument,# "All Munis" = muni_instrument,# "Other" = other_instrument,# "Schools" = school_instrument,# "Townships" = township_instrument# ),# file_stub = "instrument_validity_checks",# title = "Table X: Predict assessments by reassessment year by type",# # notes = "Cook County, Illinois data from 2008 through 2023"# # )# # #| label: instrument-validity-display# # # display_model_table(# "instrument_validity_checks",# title = "Table 1. Reassessment year as predictor of EAV change",# notes = "Cook County, Illinois data from 2008 through 2023"# )